This project is from UCI MSBA - Machine Learning for Analytics Class.
Team: Taeho Lee, Maggie Fan, Claire Minorsky, Miranda Wu, Vaishnavi Ganugapati
Tool: Python, WEKA
Project Description and Objectives
After a customer stays at an Airbnb property, they leave written reviews and a numeric review score (on a scale of 1-5 stars), which can boost or hinder the popularity and success of that listing. We will be analyzing data from New York City (NYC) Airbnb listings - a popular tourism and rental destination - to examine the relationships between host-related listing variables (e.g. if they’re a superhost, host response time, etc.) and review score ratings given by customers. Specifically, the questions we aim to answer are:
- What are the listing features of a successful (high-rated) host?
- Which individual review score categories (cleanliness, check-in, etc.) are the most associated with high overall review score ratings?
- Do host acceptance rate and response rate affect the overall review score ratings?
Data
a. Data Acquisition
The dataset was sourced from Inside Airbnb, an independent website that scrapes and uploads data from Airbnb listings for public use. The dataset we used was sourced on September 1, 2021. Prior to cleaning and manipulation, there were 36,923 rows (listings) and 74 columns (variables) in the NYC dataset. There were 21 total variables pertaining to hosts. Based on the correlation with the review scores rating variable and our research, we selected the nine independent variables that were the best for modeling the relationship between host characteristics and review scores, and removed difficult and less relevant variables.
b. Description
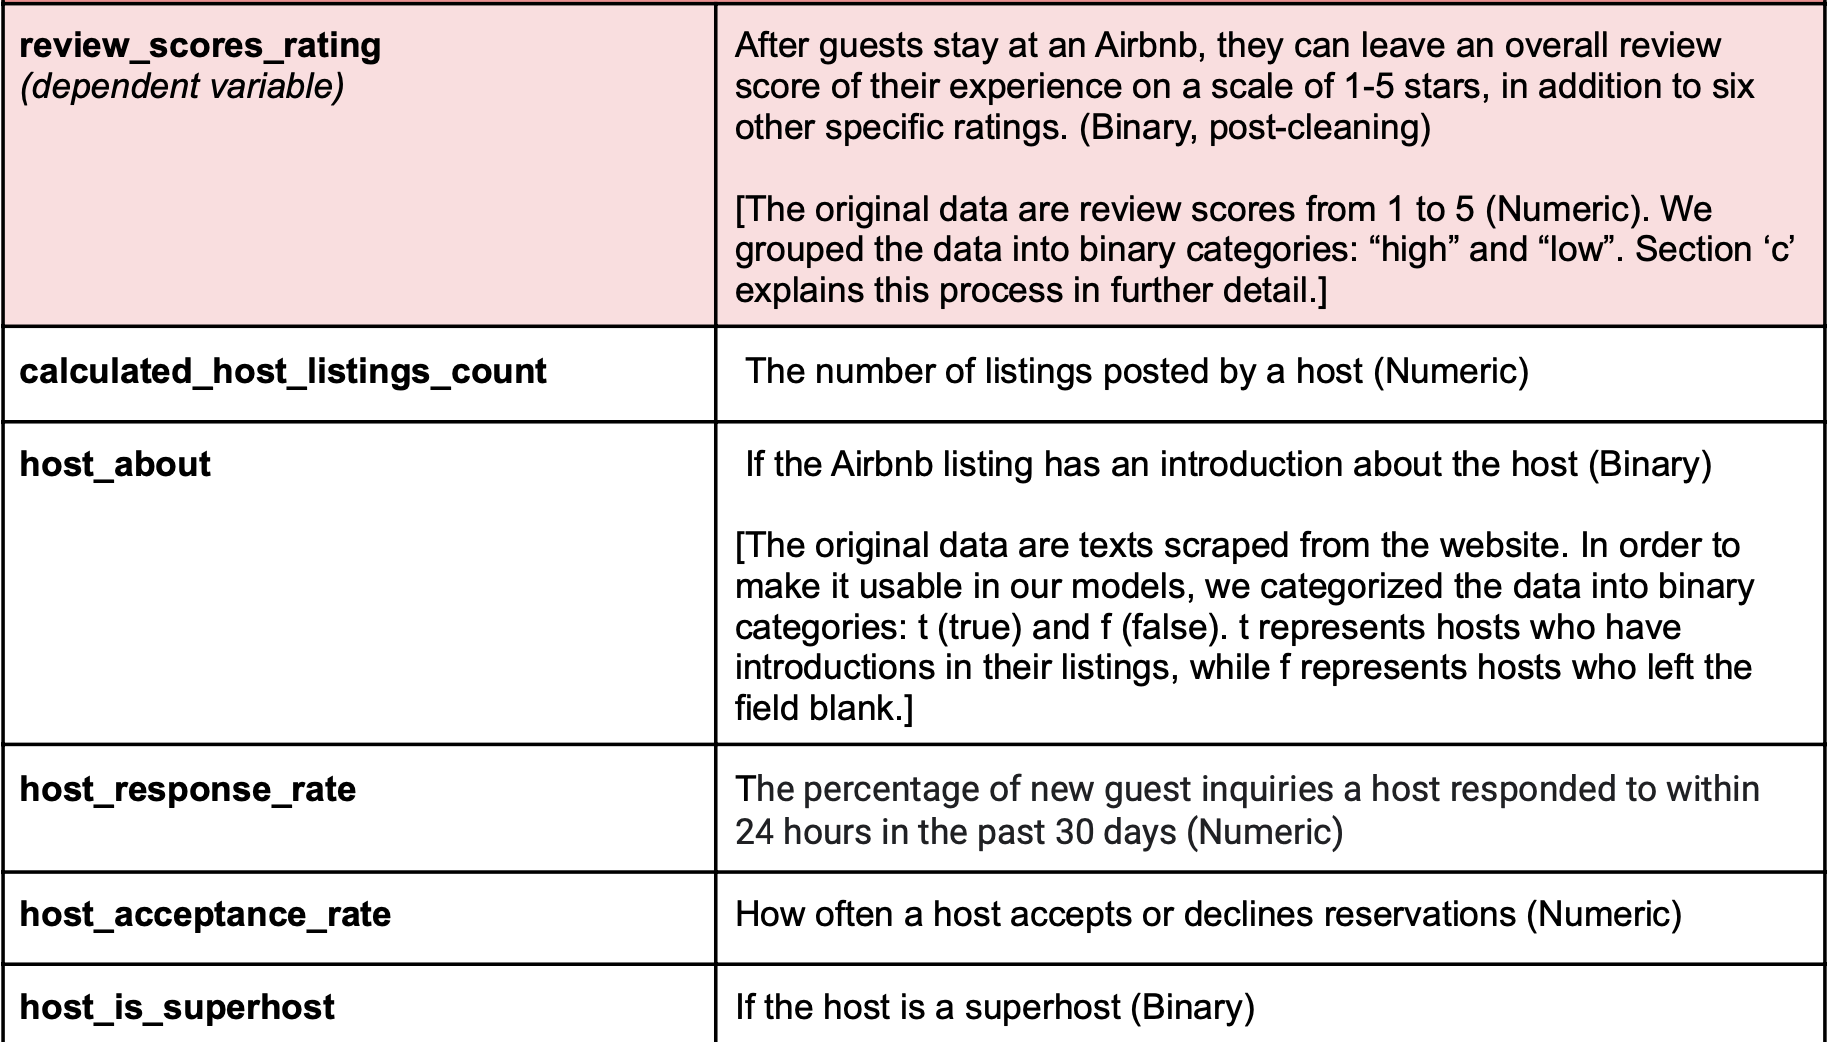
Below are the 10 variables we used in our analysis of hosts and customer review scores:


c. Cleaning Process
Before modeling in Weka, we performed some basic data cleaning using Python:
- 21,492 rows contained NaN values and were removed from the dataset. This left 15,431 rows.
- “host_about” initially contained freeform text. It was converted to a true/false field, where ‘t’ represents listings where the host had filled out the “about” field and ‘f’ represents listings where that field was left blank (NaN values).
- “host_response_rate” and “host_acceptance_rate” were converted from object data types to float by removing the ‘%’ sign. They were then changed to rates instead of whole numbers by dividing each value by 100.
- We changed “review_scores_rating” into a categorical variable with two values: “high” and “low”. This was done by first running descriptive statistics for review_scores_rating (below). Then, based on the mean value of 4.676, all values greater than the mean were changed to “high”, and all values less than or equal to the mean were changed to “low”.
d. Exploratory Descriptive Analysis
Observations from the descriptive statistics:
- All five review score categories have fairly low standard deviations and values concentrated on the high end of the range (4.53 or higher, on a scale from 1-5). review_score_cleanliness has the lowest mean (4.645) and median (4.53) scores.
- host_response_rate is also very concentrated towards the high values, with most of the data falling between a rate of 0.91 - 1.0.
- calculated_host_listings_count has the widest range, with a minimum value of 1 and a maximum of 307. Most of the data is concentrated between 1-5 listings, which makes sense; although Airbnb hosting has become more commercial, it’s still uncommon for hosts to own many properties.
- Approximately one-third of the listings are posted by a “superhost”.
Modeling
We used different machine learning methods to classify which attributes make good Airbnb hosts and compare the accuracy rates of each model. Since this is a binary classification problem, we used the following four methods:
- Naive Bayes
- Decision Tree
- K Nearest Neighbors
- Logistic regression
We splited data into 70% for training and 30% for test, and then used confusion matrices to evaluate the performances of our models. We also used three different pre-processing methods:
- Resampling - We noticed that our dataset was highly unbalanced: there were 4,956 low review scores and 10,475 high review scores. A widely adopted technique for dealing with extreme class imbalance is resampling, which involves adding more samples from the minor class (Oversampling) and removing samples from the majority class (Undersampling).
- Descritization - Since our datasets contain seven numerical variables, we also decided to discretize them and see if this is a good method to improve the fit of the model. Discretization is a process of partitioning continuous attributes into nominal attributes. In this case, we discretized each of the numerical variables into 10 bins in order to make them categorical.
- Feature Reduction - We decided to improve our model by selecting lower impurity attributes. The Gini impurity measures the degree of misclassification of an observation. The higher the impurity, the worse the split. Thus, we removed the variable with the highest impurity.
To calculate the Gini impurity, we needed to convert all variables into categorical variables because Gini works only in those scenarios where we have categorical targets. It does not work with continuous targets. Therefore, we divided continuous variables into two categories by using the mean of each variable, except for with calculated_host_listings_count. For this variable, using the mean value for standard doesn’t give any meaningful insights because there are few hosts who have a high number of listings and heavily increase the mean. So, we decided to apply the standard of having only one listing or one more listing for this variable. To calculate Gini impurity for a set of items with J classes, and success probabilities of each class is Pi, the formula is defined as:

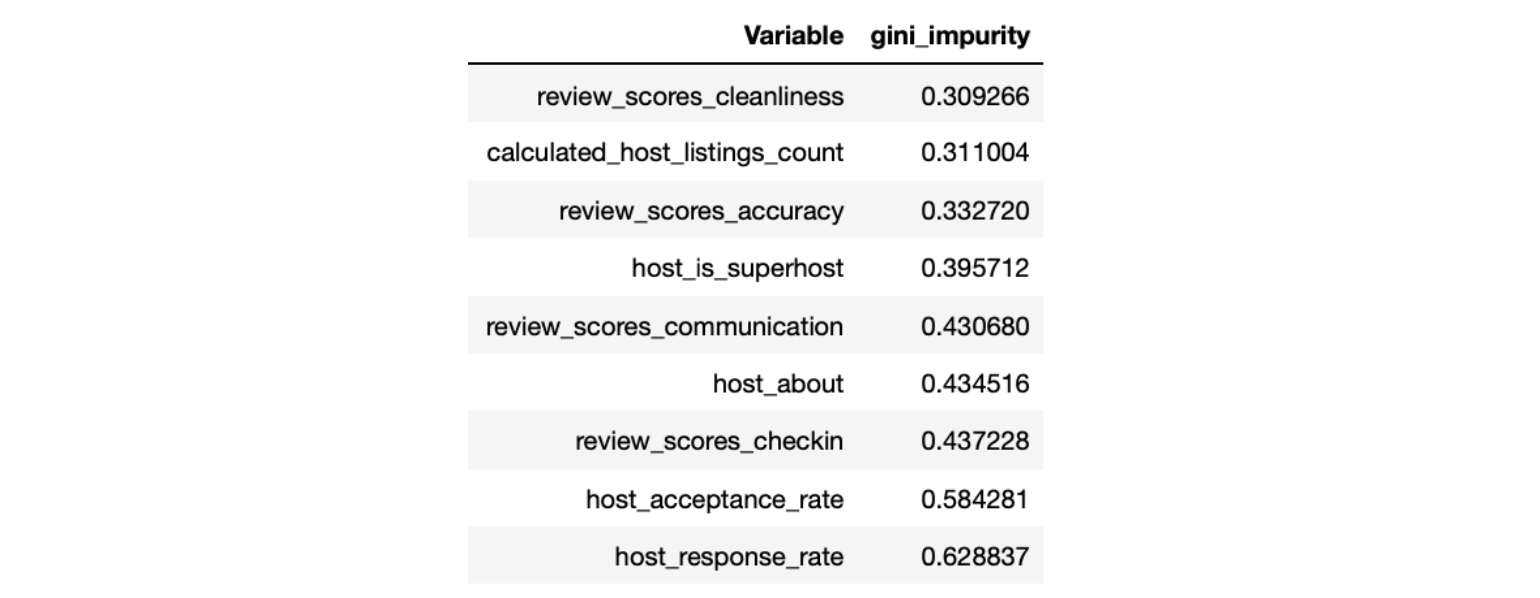
We then calculated the weighted Gini impurity. The weight of a node is the number of samples in that node divided by the total number of samples in the parent node. Below is the weighted Gini impurity of our variables:

By calculating the weighted Gini impurity, we saw that the “host response rate” has the highest weighted Gini impurity. We then removed it and trained our models again to see if it improved the model accuracy rate.
Result
a. Naive Bayes

After discretizing, the overall accuracy rate goes up to 84.06% and the stratified accuracy for “low” is also much better than the un-preprocessed model. Therefore, we can conclude that the “discretize” preprocessing method did beat the benchmark performance set by the un-preprocessed Naive Bayes model.
b. Decision Tree

Comparing the results of the other three pre-processing methods, we found:
For discretizing, the overall accuracy rate goes down to 85.18%.
For feature reduction, the overall accuracy rate goes up a little bit, but the stratified
accuracy for “low” decreases.
After resampling, the overall accuracy rate goes up to 89.89%. Also, the stratified accuracy for “low” becomes 91.11%, which is much better than in the un-preprocessed model.
Therefore, among the models above, we can conclude that “Resample” did improve the Decision Tree model performance the most.
c. K Nearest Neighbors

After using resampling and feature reduction, the overall accuracy rate, stratified accuracy for “high”, and stratified accuracy for “low” increased to 92.16% and 83.88%. Therefore, we found that “Resample” improves the model’s performance the best between the two preprocessing methods.
d. Logistic Regression

We can see that after resampling, the accuracy goes up to 87.69%, which was the highest. And by using the resampling logistic regression model, the odds ratios are:

Among these variables, one variable has a negative influence on review scores rating, while the other five variables have positive influences. To understand the effects of the predictors, we looked at the odds ratios for each variable and can conclude that if:
- “Host is super host” is true, the probability of a high review score increases by 184.62%
- “Host acceptance rate” increases by 1 unit, the probability of a high review score decreases by -39.36%
- “Review scores accuracy” increases by 0.1 unit, the probability of a high review score increases by 55.13%
- “Review scores cleanliness” increases by 0.1 unit, the probability of a high review score increases by 40.07%
- “Review scores checkin” increases by 0.1 unit, the probability of a high review score increases by 22.59%
- “Review scores communication” increases by 0.1 unit, the probability of a high review score increases by 34.98%
Most of the variables have positive impacts, which is reasonable. “Host acceptance rate” is the only variable that has a negative impact on review score rating. We think this is because if the host accepts most guests, rather than being selective, there will be a risk that bad guests might give a low review score. Moreover, when a host accepts too many customers, it may also lower the quality of service, causing the review score to go down.
Conclusion
The review score rating is the easiest marketing tool to attract customers, so hosts want to raise their ratings by any means. The overall review score ratings on Airbnb can be mostly explained by the individual review score ratings. It is interesting that some ratings are more influential than others. Accuracy, cleanliness, and communication were the top three most statistically significant variables. This makes sense, as consumers want the property to match the listing information they saw when booking, want their place to be clean, and want a host who can quickly solve problems.
Because “accuracy” was an influential variable, hosts should make sure their listing descriptions depict the true condition of their properties. Even if the house is good enough to get a high overall score, it is difficult to get a good accuracy score when it fails to meet customers’ expectations.
Furthermore, it is interesting that higher acceptance rates were correlated with lower ratings, which suggests that business models that have ratings as crucial factors to their success should not be completely customer-centric. Hosts are fairly sensitive to customer ratings, and if there are no systems that filter out or replace malicious customers, customers can use this rating system intentionally to take advantage.
Currently, our results are somewhat limited in scope, as it only applies to NYC. It would be insightful to apply these modeling techniques to other cities in various countries to see if the results are consistent.


