This project is from UCI MSBA - Data and Programming Analytics Class.
Team: Taeho Lee, Maggie Fan, Claire Minorsky, Miranda Wu, Vaishnavi Ganugapati
Tool: Python, Tableau
Project Description and Objectives
New York City (NYC) is one of the top tourist destinations in the world and is home to over 30,000 Airbnb listings. While there are many factors customers consider when choosing an Airbnb property in NYC, price is one of the most important. Hosts set prices for their listings based on multiple variables. In our project, we analyzed this relationship between price and other variables, such as location, review scores, and host responsiveness. The specific questions we aimed to answer were:
- Which variables have the strongest relationships with price?
- Do the influential variables change within different neighborhoods of NYC?
This analysis could help new Airbnb hosts determine how to set competitive prices for their listings. It could also help guests understand how listings are priced.
Exploratory Descriptive Analysis
Our dataset came from Inside Airbnb and contained 36,923 rows (unique listings) and 74 columns (variables). Variables were related to different subjects, such as host characteristics, listing descriptors, listing availability, and customer review scores.
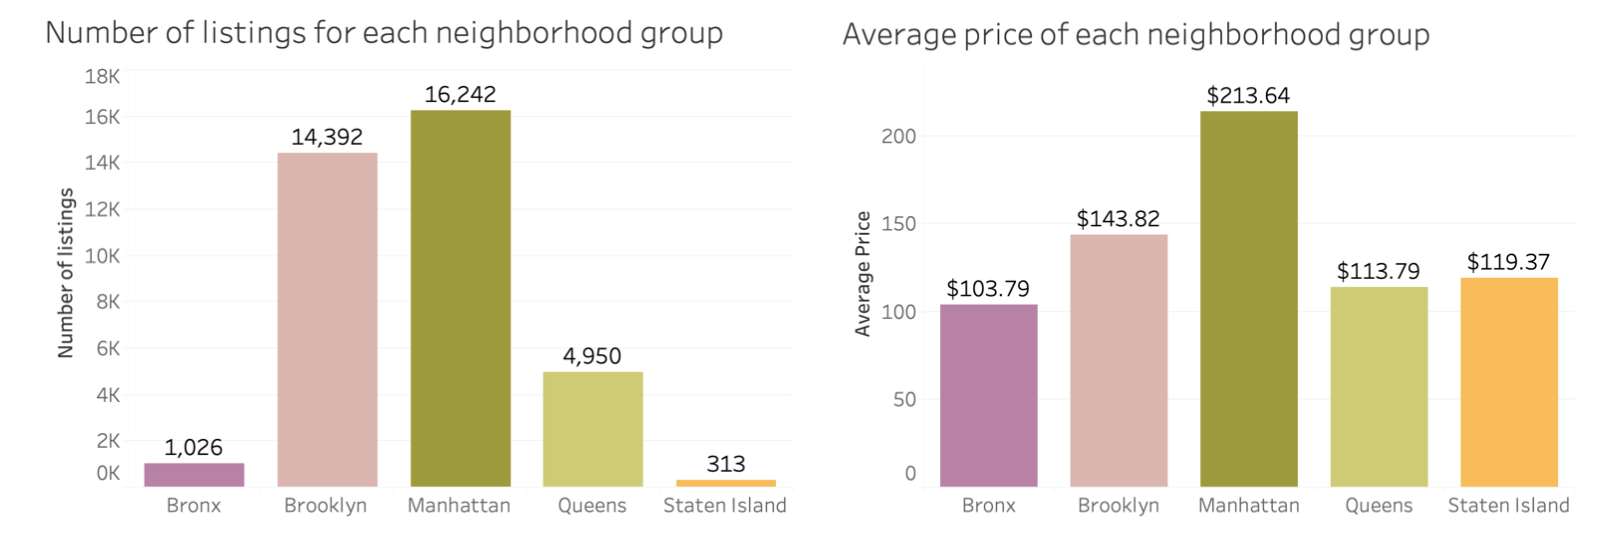
The dataset contains over 200 unique neighborhoods in NYC, which are divided into 5 major groups: Manhattan, Brooklyn, Queens, Bronx, and Staten Island.
we can see that Manhattan has the most listings in the dataset, followed by Brooklyn, while Staten Island has the fewest.
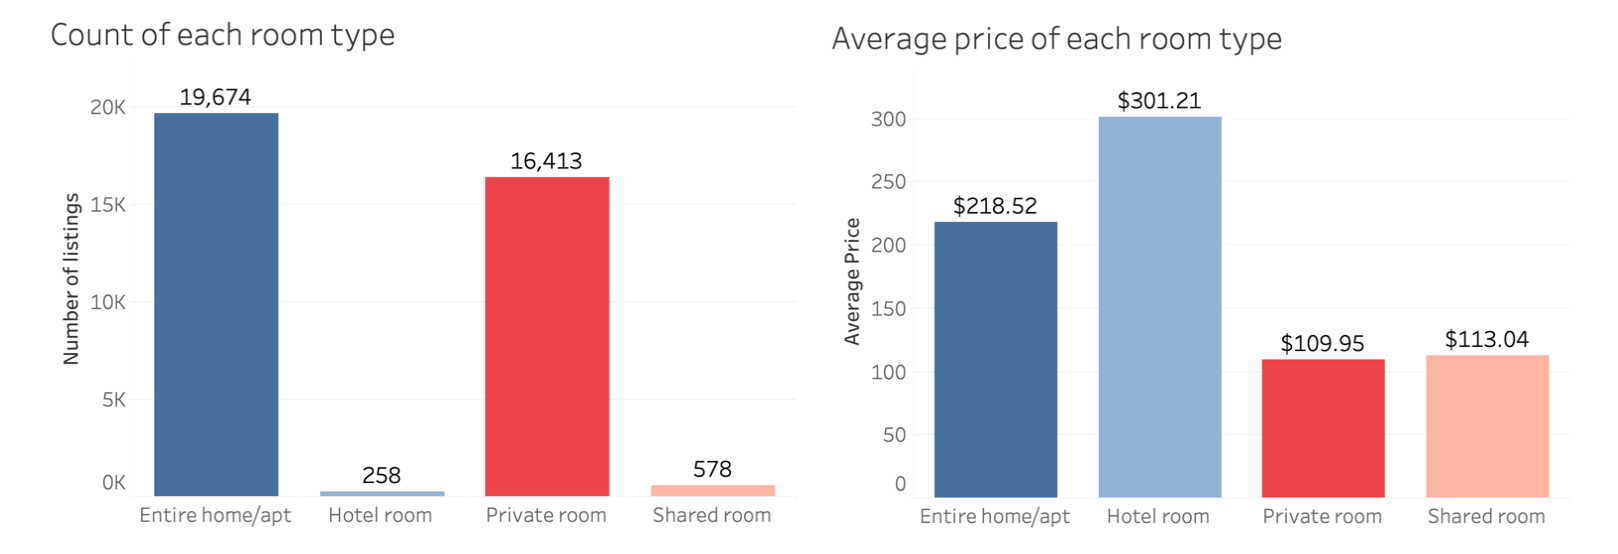
There also appears to be a relationship between room type and price, as visualized below. Hotel rooms make up a small fraction of the data but have the highest prices.
Data Cleaning
We began the cleaning process by deleting NaN values, which left us with 13,558 rows. We then changed the data types of several variables to make them easier to work with:
- Categorical variables were converted to dummy variables: neighborhood_group_cleansed and room_type
- t/f variables were changed to 1/0: instant_bookable, host_identity_verified, host_is_superhost
- Numeric variables stored as strings were converted to floats by removing symbols ($, %): host_response_rate, host_acceptance_rate, price
- Since price is highly right skewed, outliers were removed based on the 1.5 IQR for price. The new cutoff for max price was $370 instead of $10,000 in the original data.
Variable Selectioin
We selected 25 variables out of the 74 in the original dataset that we felt were most relevant to price. We then checked for high collinearity between those variables. Within high collinearity variable groups, we both considered correlation between each variable and correlation with price.
Regression Modeling
Model Creation for NYC
We started the regression model process by splitting the dataset into 70% training and 30% test data. We used the training data to build an OLS regression model. After running the regression model, we found five insignificant variables, whose p-values were above 0.05.
The five insignificant variables were (variables/p-value):
1) Instant_bookable (0.137)
2) Calculated_host_listings_count (0.198)
3) Review_scores_accuracy (0.536)
4) Review_scores_checkin (0.615)
5) Maximum_nights (0.234)
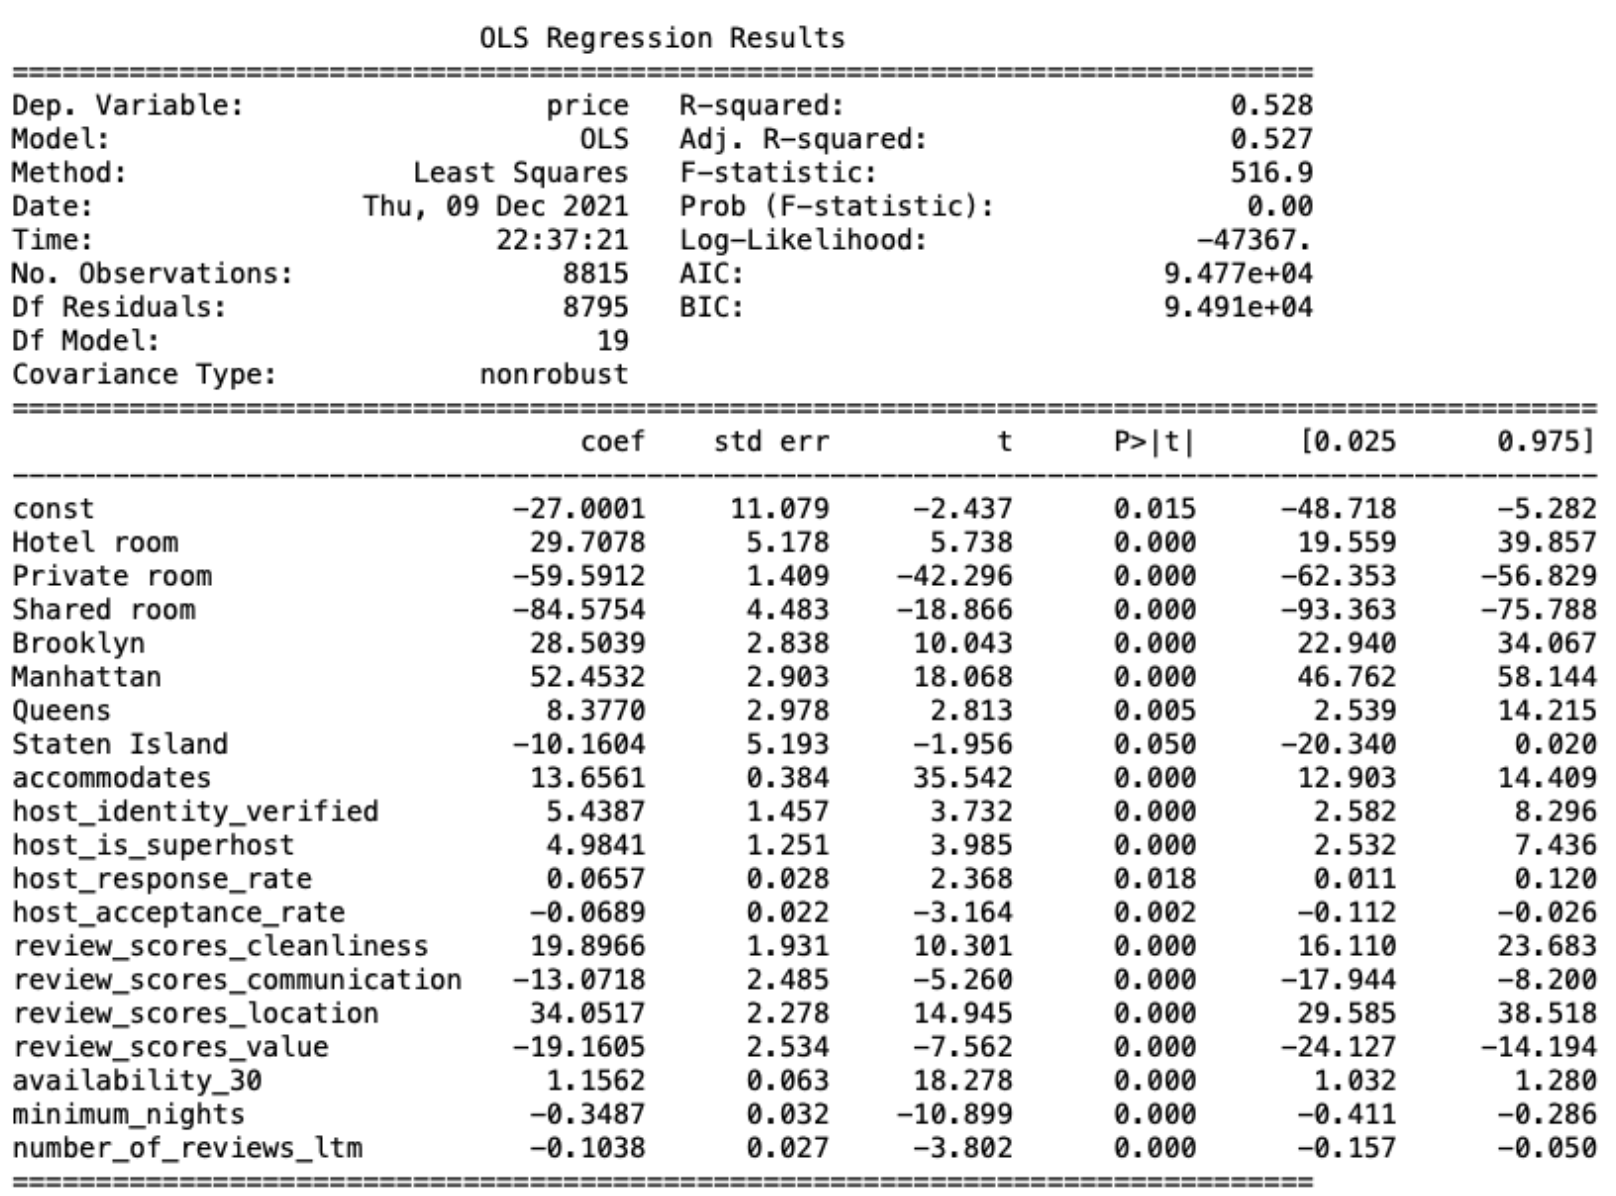
Next, we removed the insignificant variables and re-ran the model, and we can see that all the variables were statistically significant:
Evaluation for NYC model
We ran regression with the test set and checked the adjusted R squared in order to evaluate whether this is a good model to predict the price of the new listings. The adjusted R squared value for the testing set is 0.494, which is consistent with the training set’s adjusted R squared.
Model Creation for NYC neighborhoods
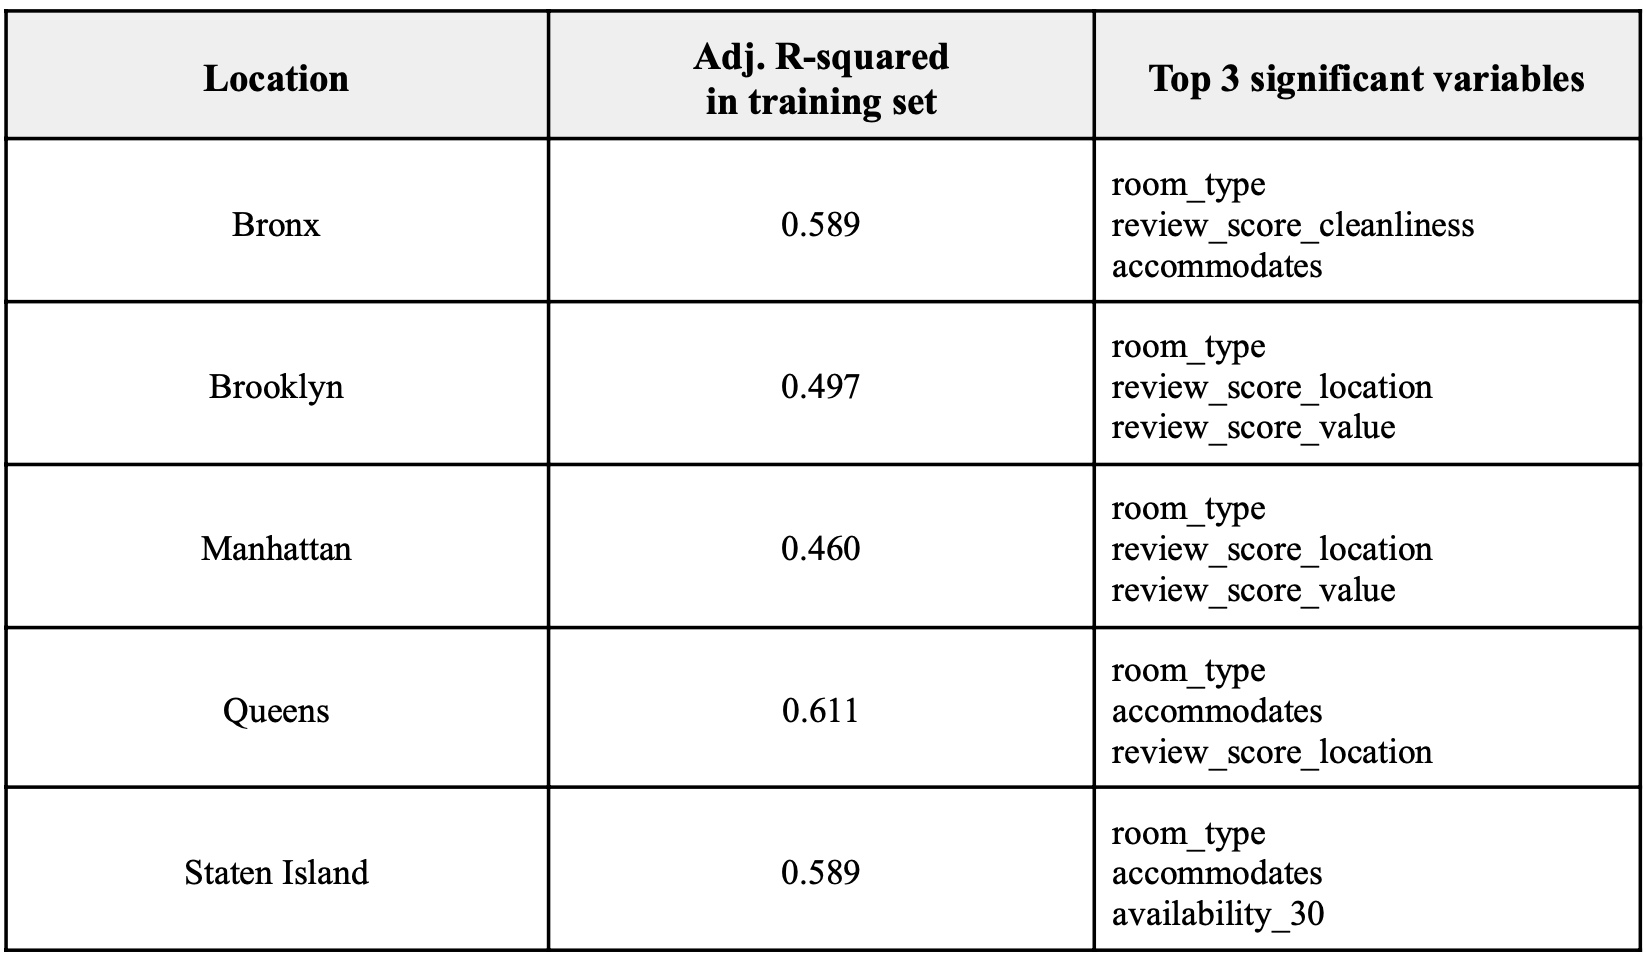
We learned from the results of the previous NYC model that room type and location have the biggest impact on price, so we wondered which variables would have the biggest impact on price if the locations were constant. To find the answer for this, we created a model for each NYC neighborhood group (Bronx, Brooklyn, Manhattan, Queens, Staten Island). We used the same method as the NYC model, but removed the location variables from the existing variables. The top three important variables for each model were:
Evaluation for NYC Neighborhoods
We ran the regression models with the test set and checked the adjusted R squared for each location. Adjusted R squared was consistent and acceptable with the training and testing sets. Manhattan and Brooklyn had lowest adjusted R squared (weaker fit), which means that listings in Manhattan and Brooklyn are less explained by selected variables compared with other locations.
Analysis of Results
Based on the p-values and the coefficients in the model, we identified the important variables as follows. There are ten variables that had positive relationships with price and six had a negative relationships:
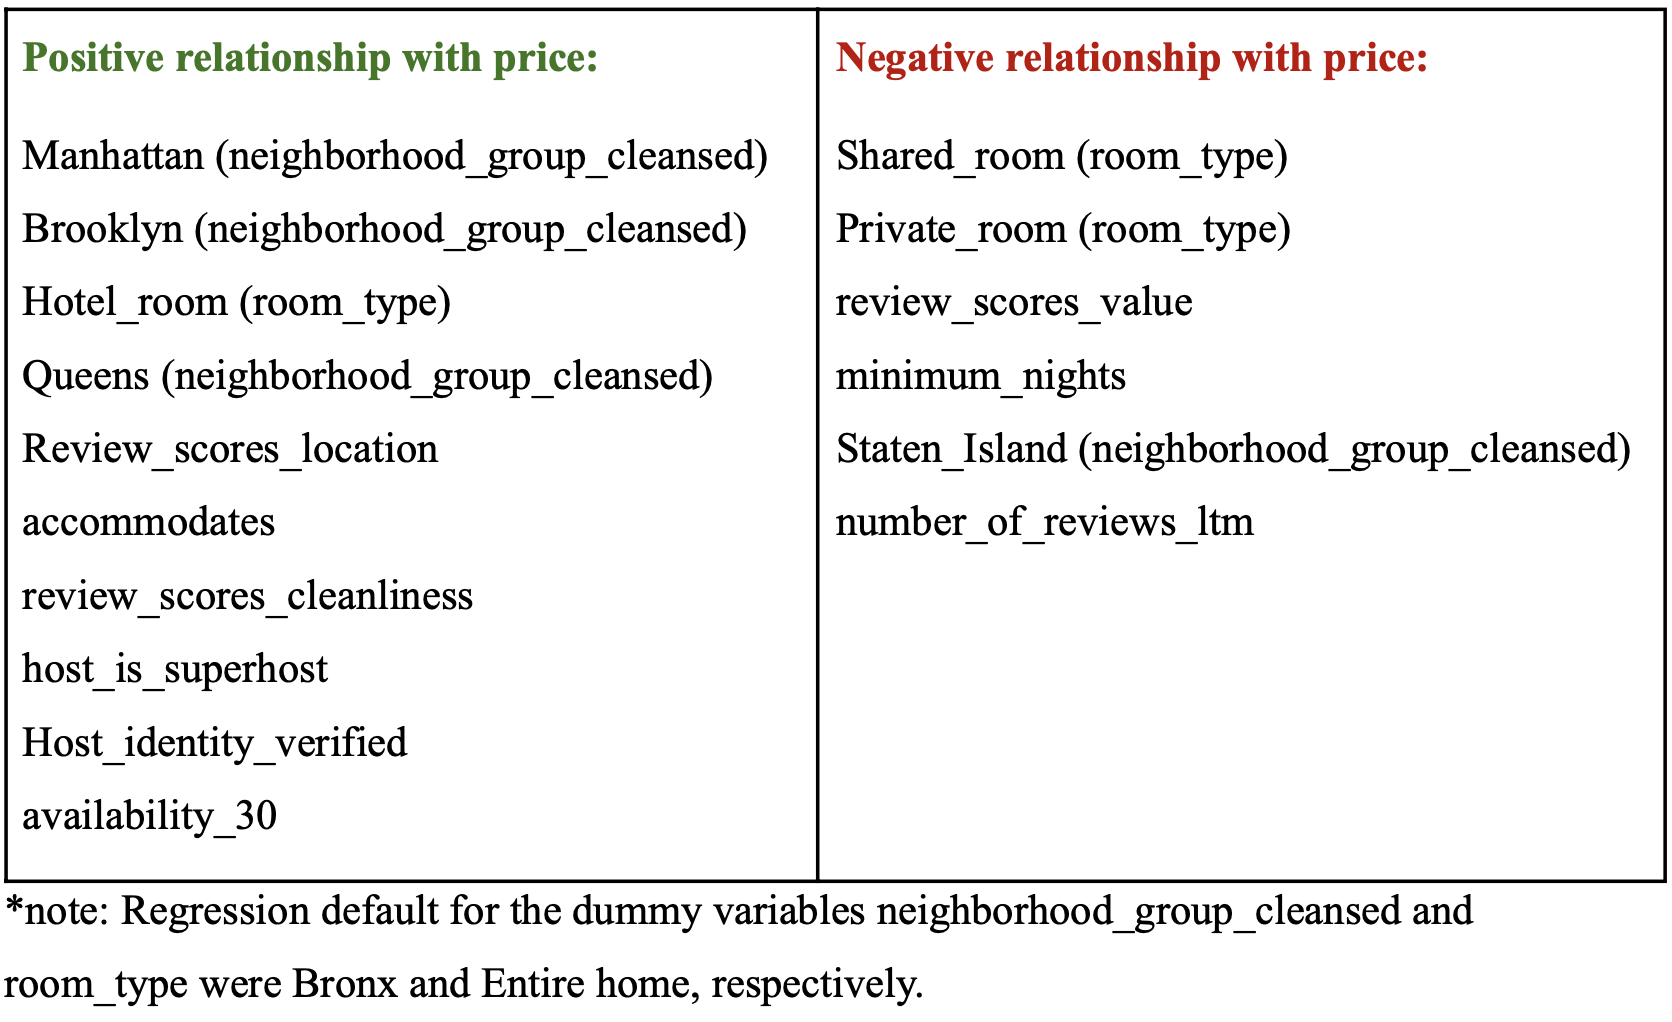
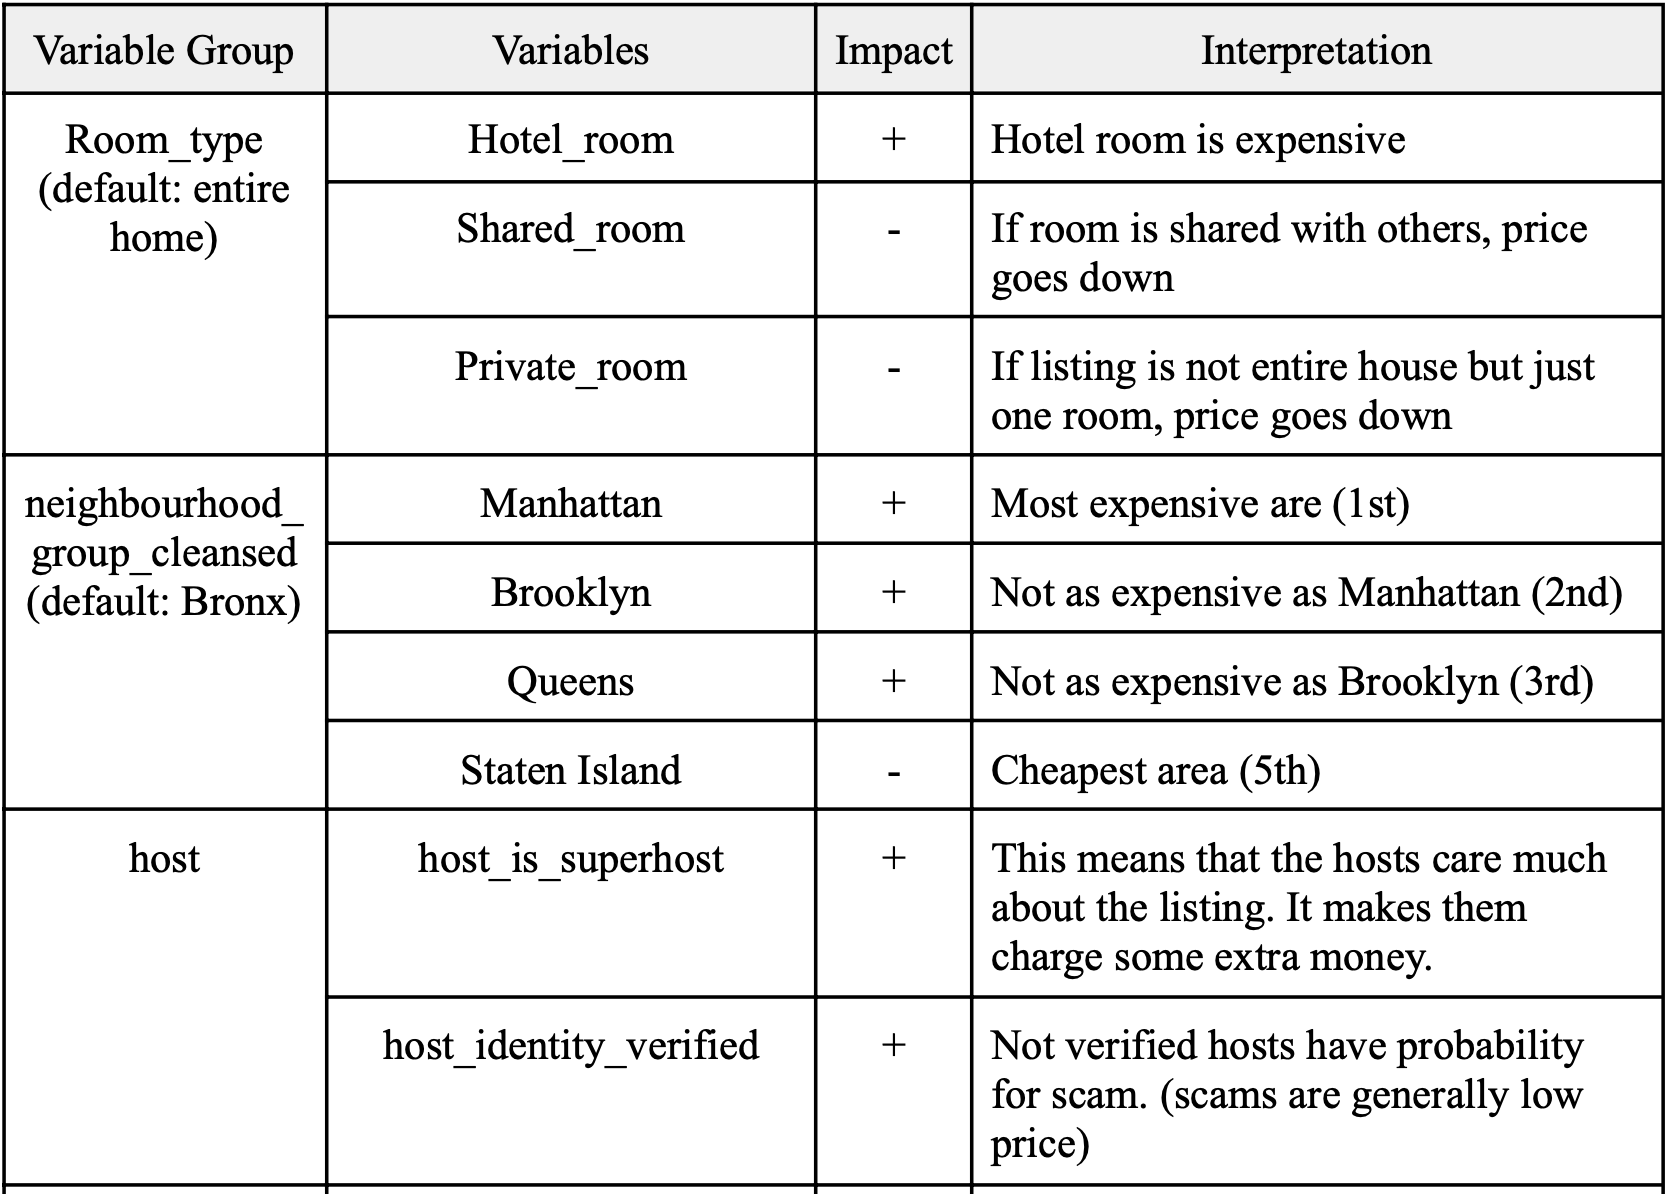
Room type is the most important variable to the overall model, followed by neighborhood group. Airbnbs located in nicer or more touristy areas (like Manhattan) were associated with high prices, while those in less desirable neighborhoods (Staten Island) were associated with lower prices. As for room types, hotel rooms had higher prices, while accommodations that were shared with hosts or other guests had lower prices.
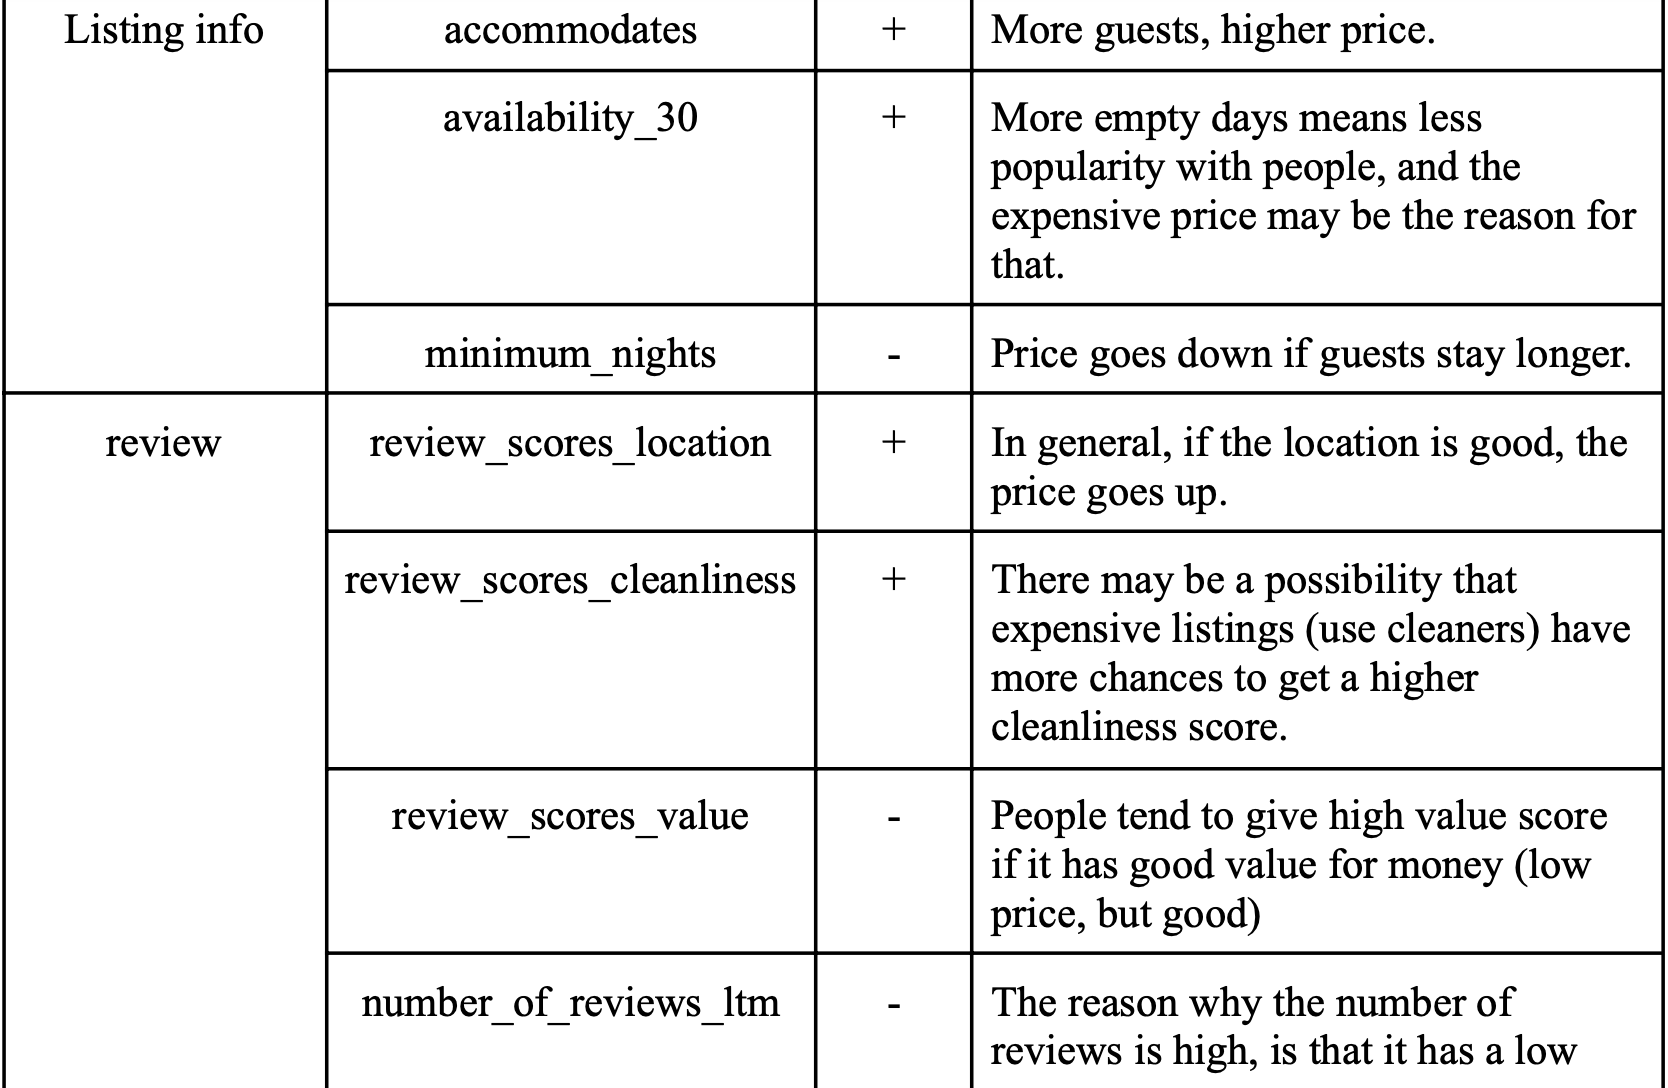
Another interesting relationship was that “review score value” has a negative association with price. We think it is because guests tend to give a high score in this category when they perceive the property as a good deal, which tends to be associated with lower prices.
The specific interpretation for each variable are below:

Key Takeaways
a. Model Conclusions
In conclusion, our model shows the relationships between multiple variables and price but not causality. Breaking the model down to specific neighborhoods instead of just the five neighborhood groups may help improve model accuracy, but this would also increase complexity due to the number of required dummy variables. Our model was also weaker at predicting luxury prices because we removed high price outliers. Incorporating text variables for description words associated with luxury (e.g. pool, king bed) might increase accuracy for high-priced listings.
b. Business Applications
Airbnb pricing is largely influenced by objective factors, like location, room type, and property size. Host-specific variables (e.g. response rate) aren’t as influential on price. Our model can provide new hosts with price setting recommendations. It can also help rental property investors choose properties to purchase, based on which locations (Manhattan, Brooklyn) and property types have the most earning potential.


