This project is from UCI MSBA - Predictive Analytics Class.
Team: Taeho Lee, Chloe Ko, Jiwon Ko, Tiffany Dinh, Lilyan Zhao
Tool: R
Project Description and Objectives
Air carriers are negatively impacted by flight delays. They lose millions of dollars in profits when a flight is delayed. Airline fleets and crew schedule are largely based on scheduled time. So when a flight is delayed, the airline suffers from extra crew cost, cost associated with disrupted passengers, and cost of aircraft repositioning.
Flight prediction is important because it would help airlines be more proactive rather than reactive. We believe that doing flight delay prediction would help airlines be more prepared in the case of a delay and to increase customer satisfaction.
We were interested in figuring out what factors play a significant impact on flight delay besides weather. In addition, we would like to know which month, day, and time have the most flight delays in NY airports, specifically JetBlue airlines. Also, we wanted to confirm that if there would be more delays in larger airports.
Data
a. Data Acquisition
Our dataset came from Kaggle, and their data source was collected from BTS(Bureau of Transportation Statistics). We defined our target variable as flights that are delayed for more than 15 min.
b. Description
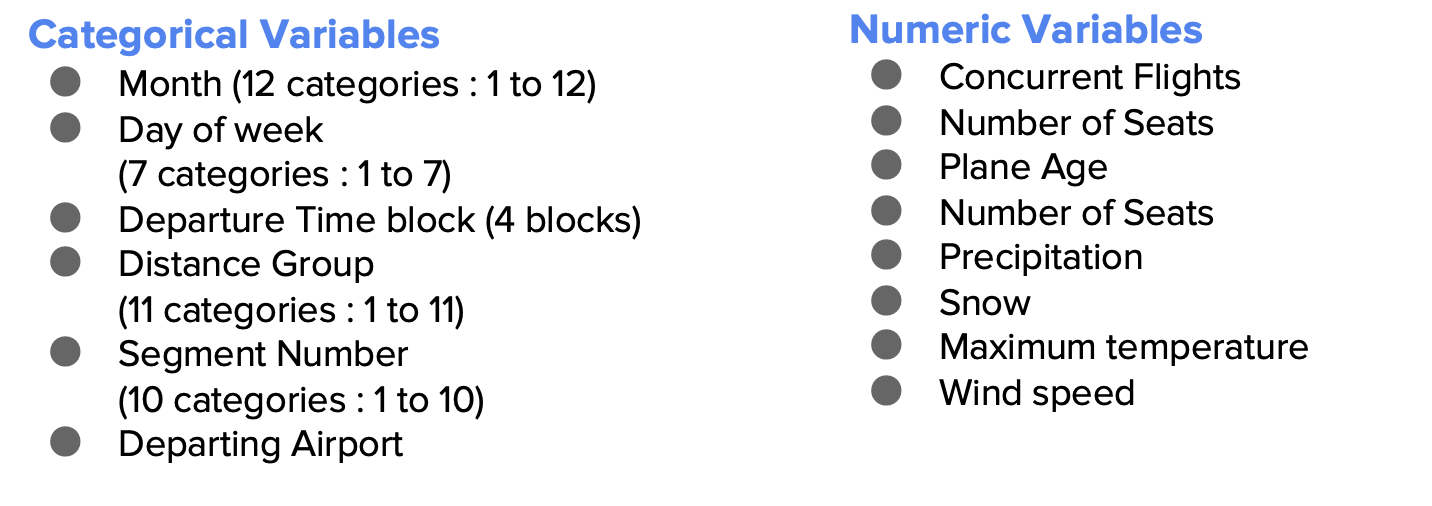
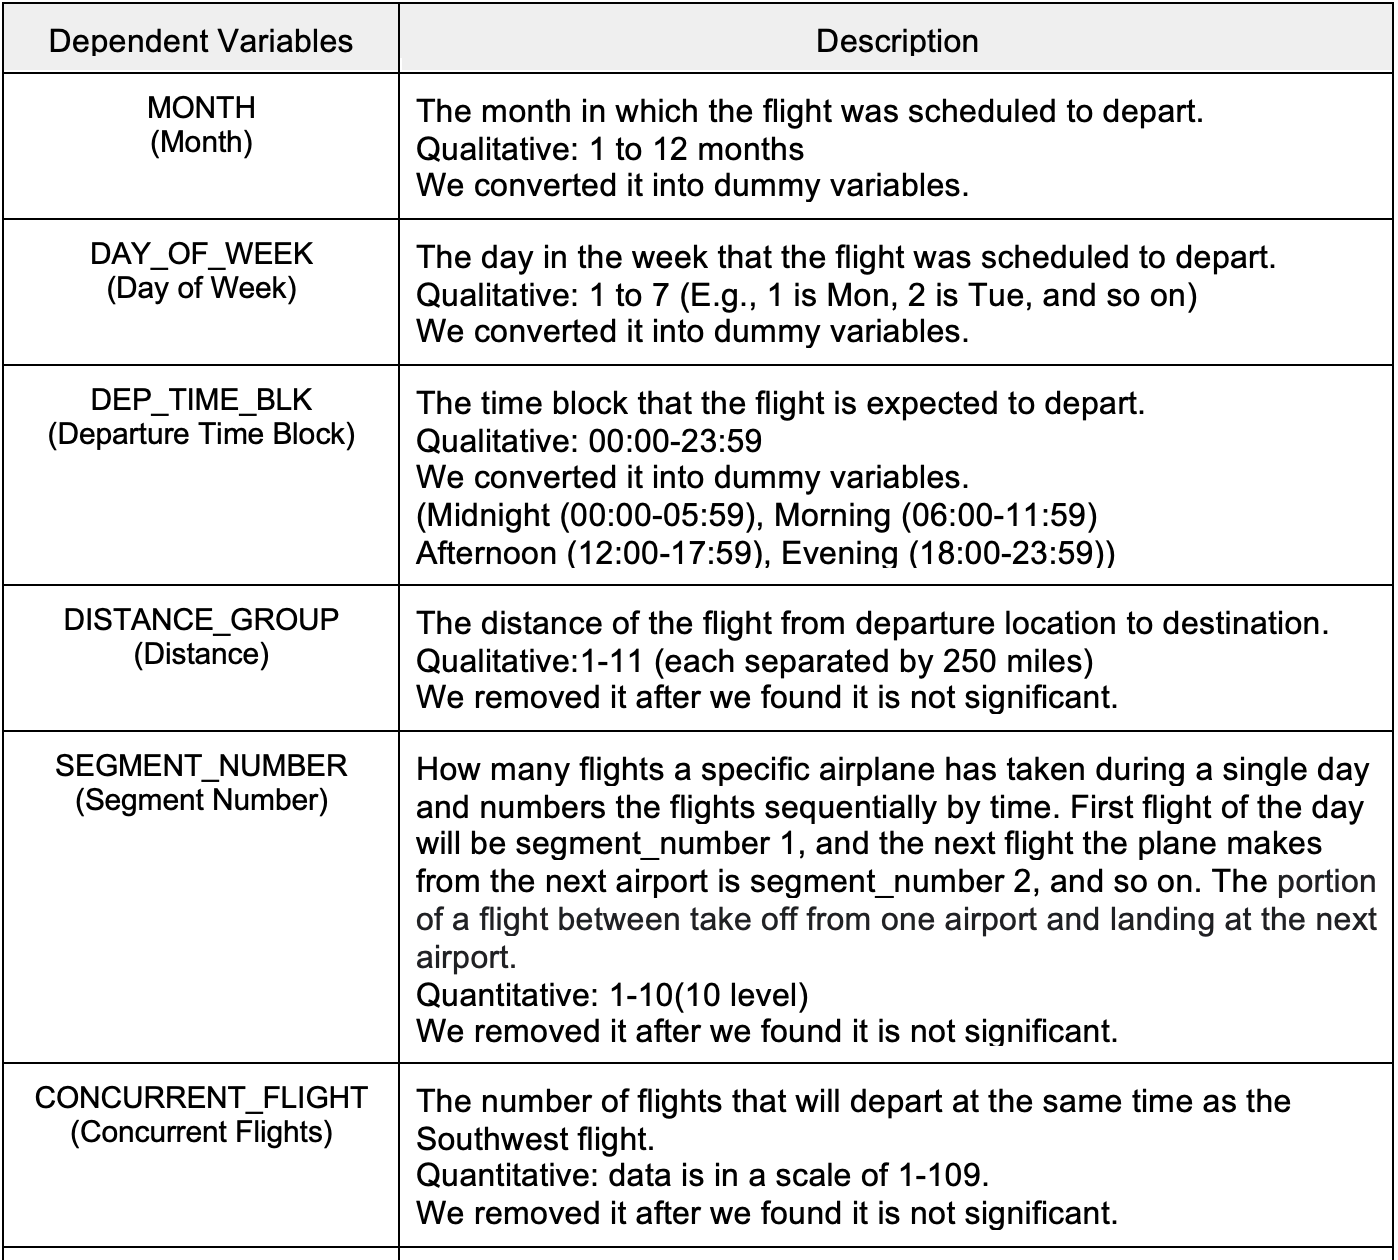
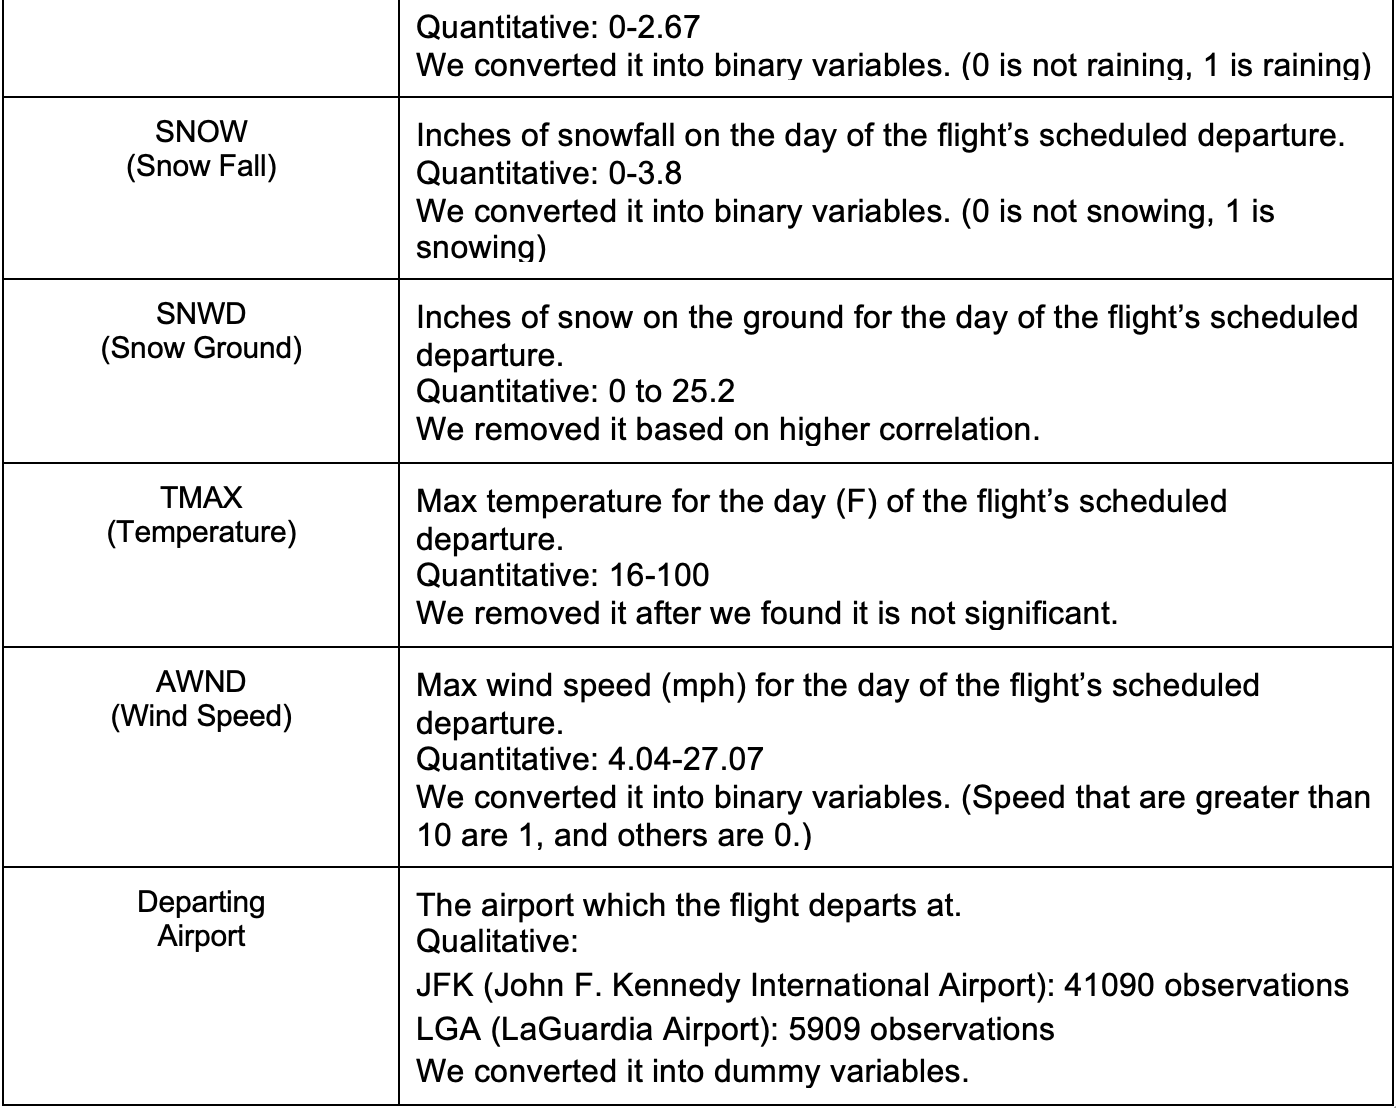
The original data set had over six million data points. In order to reduced the noise, we cleaned up our data by selecting flights from JetBlue at LaGuardia and JFK airports in NY. We used 6 categorical variables and 8 numerical variables to help us predict our target variable.

c. Exploratory Descriptive Analysis

August has the most delays throughout the year and evening has the most delays throughout the day.
Modeling Result
Summary
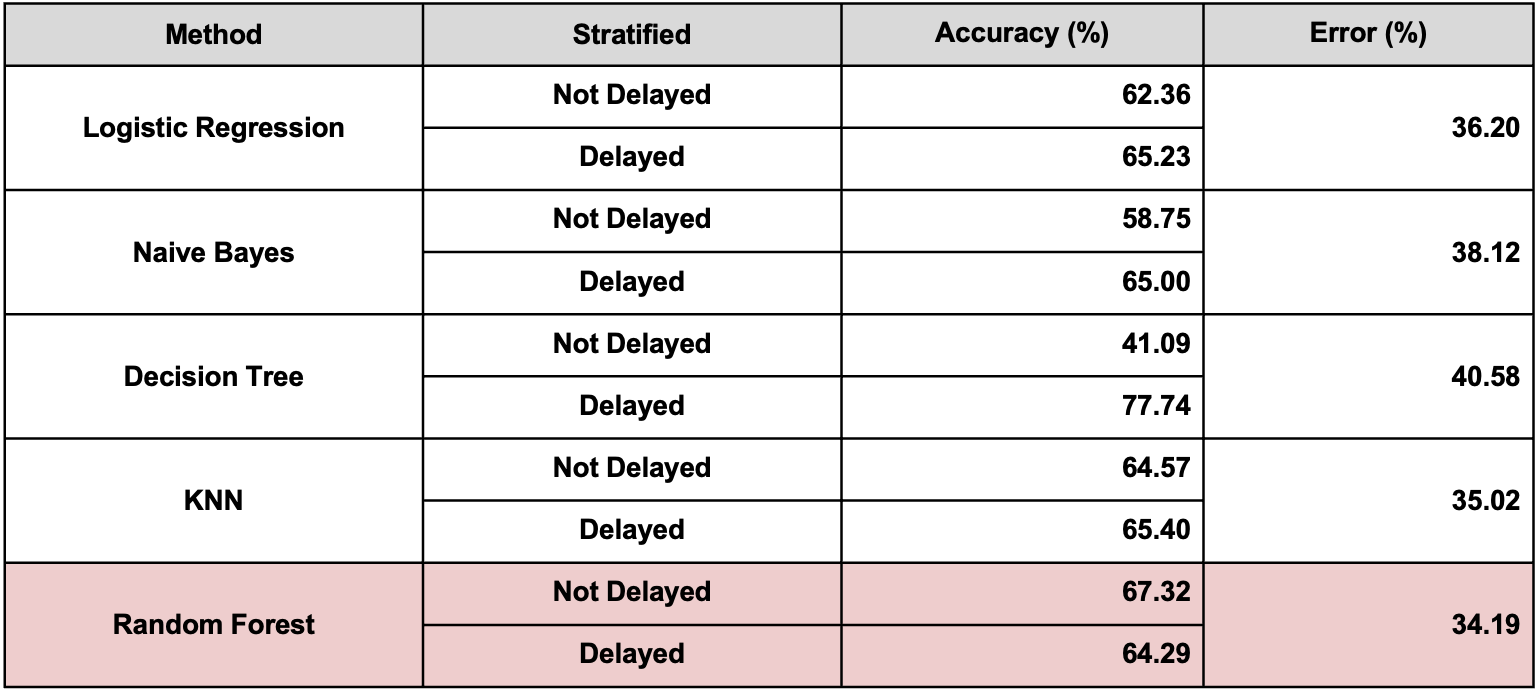
After running all models, the top 3 models are Random forest, KNN and logistic regression. We selected them by looking at overall error rate and accuracy rates of predicting both delayed and not delayed flights.
Logistic Regression


The month with the most flight delays was August and the day with the most flight delays was Friday. And the evening had the highest probability of flight delays. Rain, wind speed and snow have a significant impact on flight delay. However, LGA airport has more flight delays compared with JFK.
Random Forest (Importance Variable Plot)
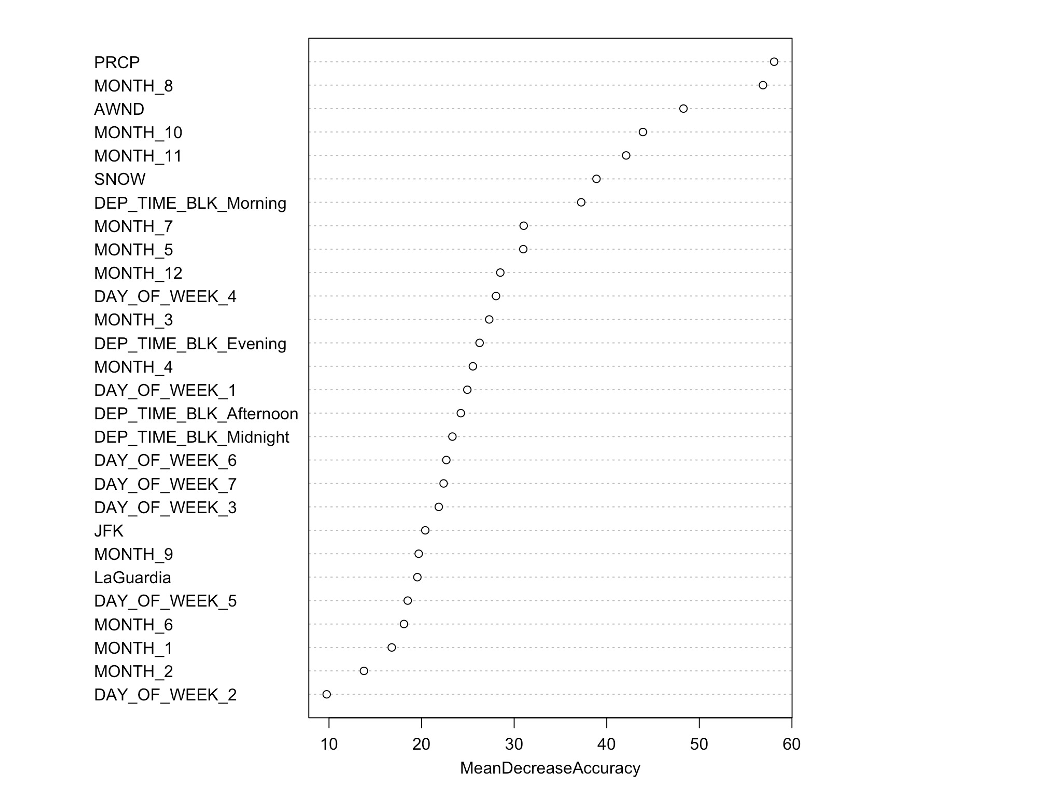
Based on the variable importance plot, we found out that PRCP, MONTH_8 and AWND are the most important variables, which means those variables are more important for a successful classification.
Prediction
We wanted to test our model performance with current data, so we used data from flightradar24 and weather underground and this is what we got.
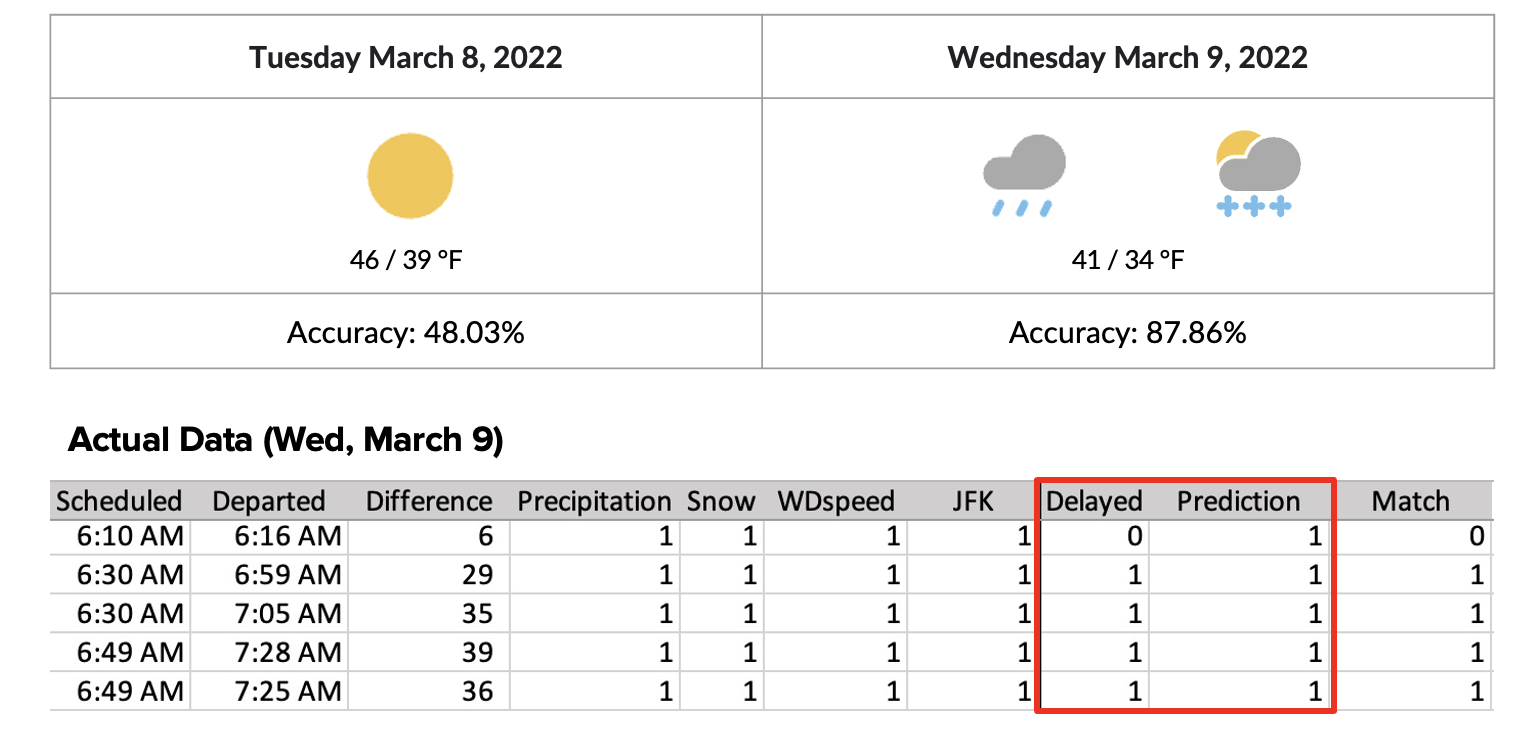
On Wednesday, the weather was very bad that day, so the prediction accuracy was very high. However, on Tuesday, despite good weather, the prediction accuracy was low due to many delayed flights (In general, there should be few delayed flights on a sunny day). Even though the weather was good that day, the reason why there were many delayed flights is that the snow that fell the day before continued to affect the next day, which is not reflected in our model.
Conclusion & Challenges
- There is a higher likelihood of flight delays in August, Fridays, and Evenings (6PM -12PM).
- There is a lower likelihood of flight delays in October, Wednesday, and Midnights (12AM - 6AM).
- We only have a model with the day weather, not the model with the specific time block weather. So, if we had a model with each time block weather, we would get higher accuracy and that would be really helpful for the business.


