This project is from UCI MSBA - Deep Learning & Applications Class.
Team: Taeho Lee, Jai Agrawal, Patrick Yip, Ed Wu, Jannie Ryu
Tool: Python
Data
a. Data Acquisition
Our dataset came from Kaggle, and face emotion images are created by gathering the results of a Google image search of each emotion and synonyms of the emotions. (FER-2013)
b. Description
The original dataset contain 35,685 examples of 48x48 pixel gray scale images of faces. Images are categorized based on the emotion shown in the facial expressions (happiness, neutral, sadness, anger, surprise, disgust, fear).
However, in order to reduce the computation time and to balance the sample size, we used 6 categories (happiness, neutral, sadness, anger, surprise, fear) and 1,000 images for each categories. And we did normalization for pre-processing and split our dataset into 60% training, 20% validation and 20% test set.
c. Evaluation Metric
We used accuracy and loss to evaluate our model performance. Because our model’s goal is to classify each class correctly, so we don’t need metrics such as precision or recall.
d. Human level Error
We tested ourselves to find out how much human error is, and human-level accuracy was about 60% for 100 random images. Logistic regression’s accuracy was about 20%, which is approximately equal to the randomly predicted probability. Therefore, it becomes more important whether it is possible to increase the accuracy by using a neural network.
Improve Training Performance
Using TensorFlow, we constructed, compiled and fitted a CNN(Convolutional Neural Network) model to training and validation data. To improve training performance, we applied methods below:
- Increase the number of layers in neural network
- Apply optimization algorithm
- Increase epochs
- Apply weight initialization
Accuracy Result
- Increase the number of layers in neural network
1) 5 layers: 55%
2) 6 layers: 75% - Apply optimization algorithm
1) Adam: 75%
2) SDG: 24%
3) Adamax: 84% - Increase epochs
1) Epochs = 10: 84%
2) Epochs = 25: 64%
3) Epochs = 50: 99% - Apply weight initialization
1) random uniform, bias = 0: 99.81%
2) he uniform, bias = 0: 99.92%
3) random uniform, bias = 0.4: 99.97%
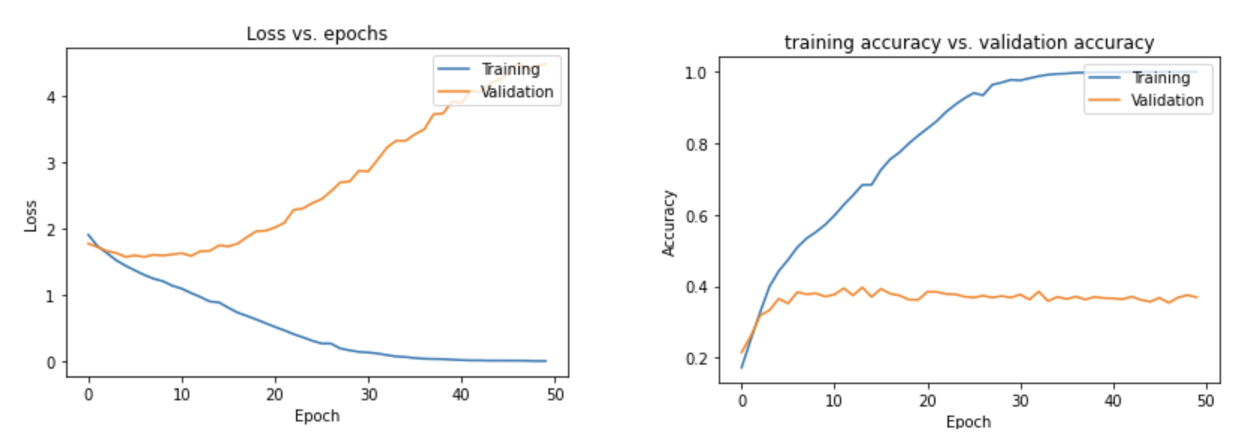
Our best model got 99.97% prediction accuracy for training set, but only got 37.50% for validation set. Yes, our model has the overfitting problem. The difference between training and validation set is about 62%, so we need to reduce it.
Improve Validation Performance
To improve validation performance, we applied methods below:
- L2 Regularization
- Dropout Regularization
- Mixture of L2 and Dropout
- Batch Normalization
- Mixture of Dropout and Batch Normalization
- Mixture of L2, Droptout and Batch Normalization
- Early Stoppoing
Accuracy Result
We at least applied five different parameters for each methods, and these are the results :
-
L2 Regularization
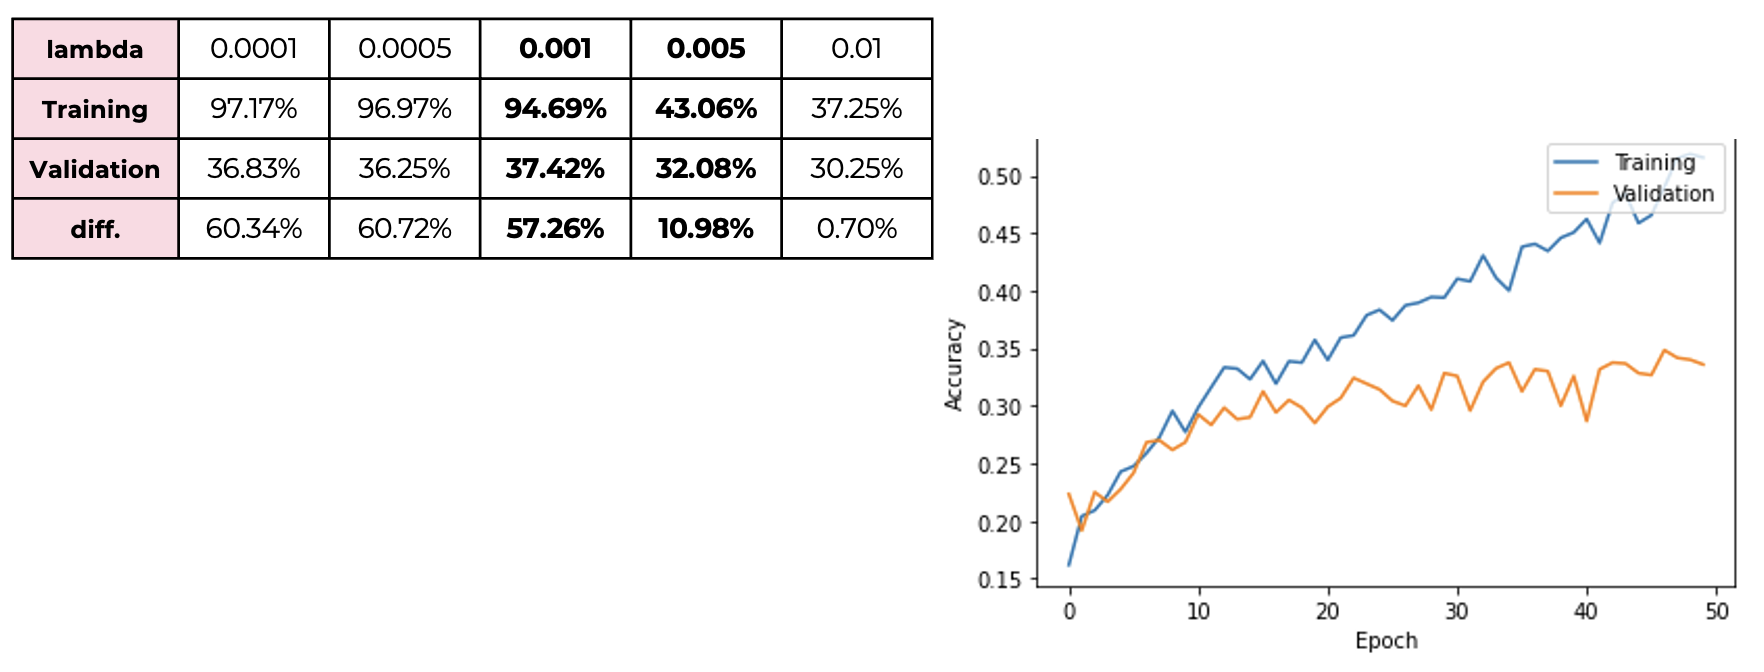 We can see that the difference decreased as the lambda value increased. However, if the lambda is too big, accuracy goes down, so we can conclude that between 0.001 and 0.005 is the appropriate range of the lambda.
 -
Dropout Regularization
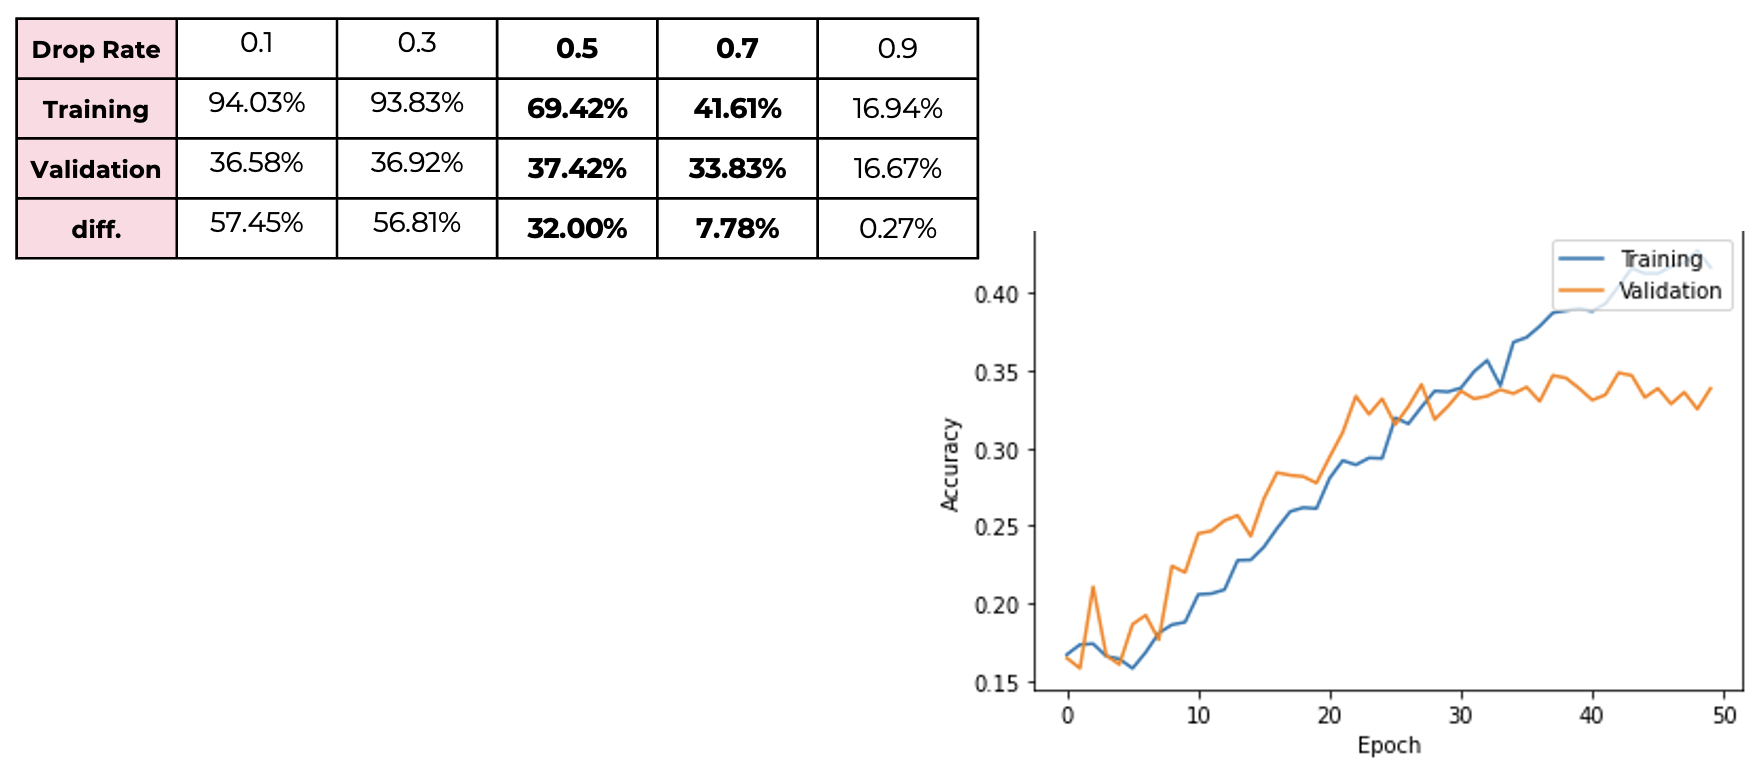 Second we apply dropout Regularization to our model, and we can see that the difference also decreased as the dropout rate increased. However, if the dropout rate is too large, accuracy goes too low, so we can conclude that between 0.5 and 0.7 is the appropriate range of the dropout rate.
 -
Mixture of L2 and Dropout
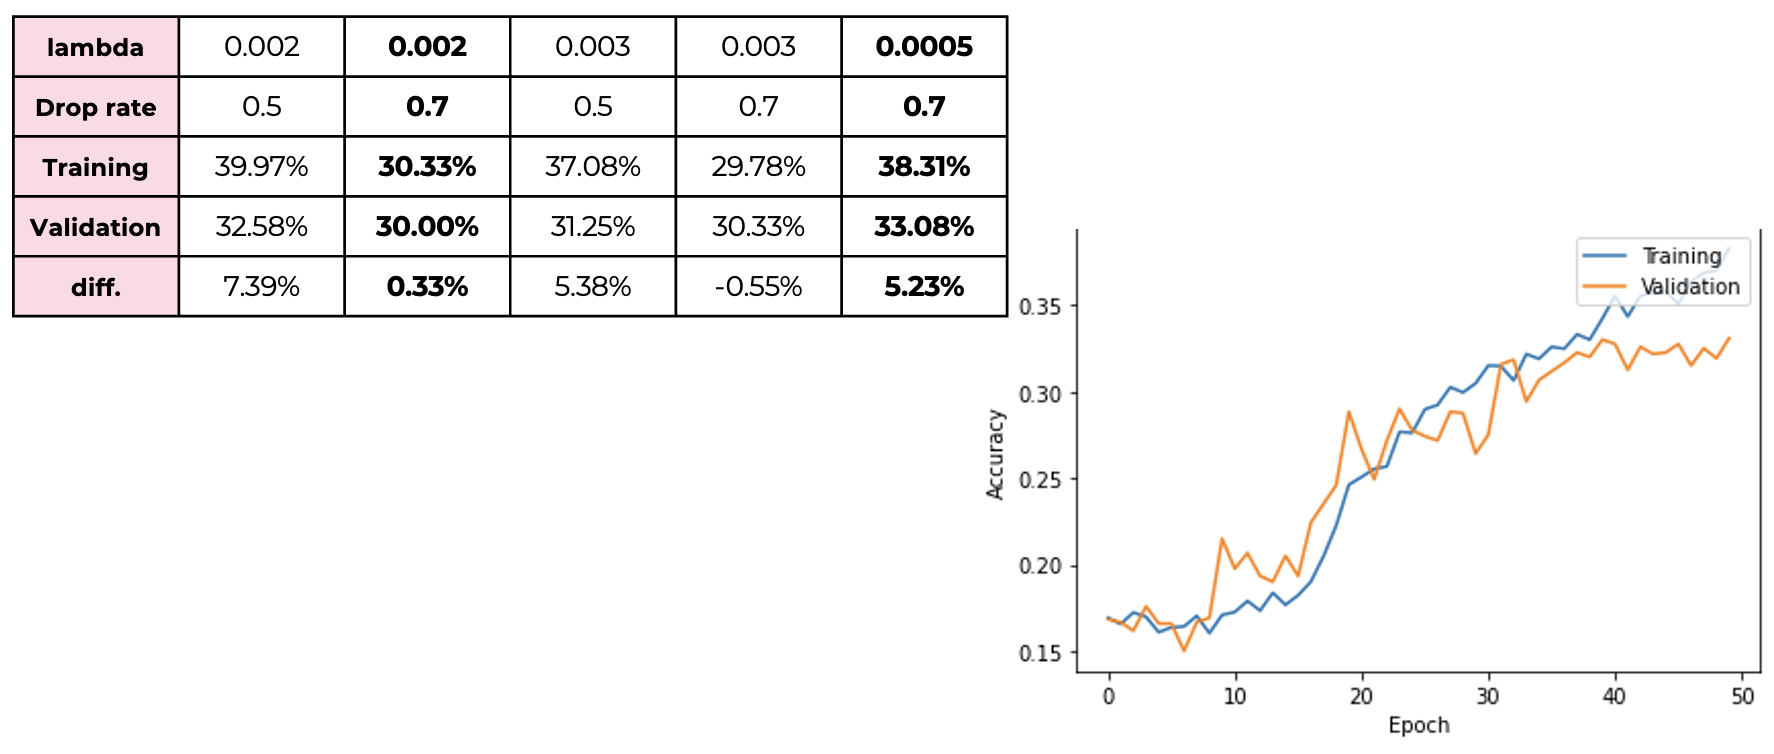 By using the mixture of L2 and dropout, we can decrease the difference to 5% but accuracy little goes down compared to the original validation accuracy. Next, Jennie will explain batch normalization.
 -
Batch Normalization
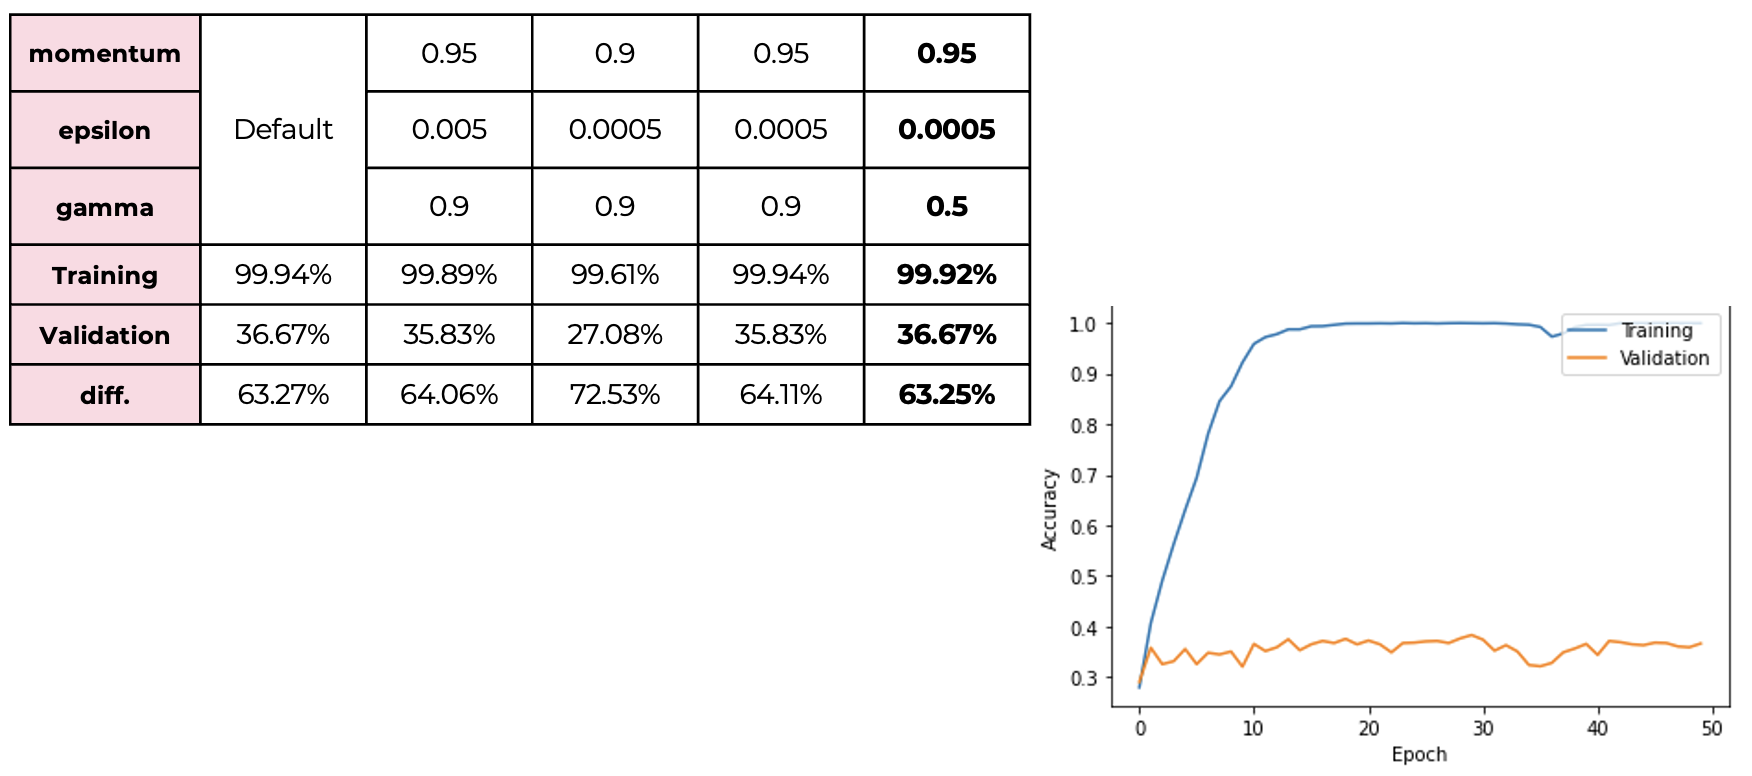 Next, we apply batch normalization to our model, but it is not as powerful as L2 or dropout regularization method.
But We found that decrease epsilon and gamma can reduce the difference between training and validation accuracy.
 -
Mixture of Dropout and Batch Normalization
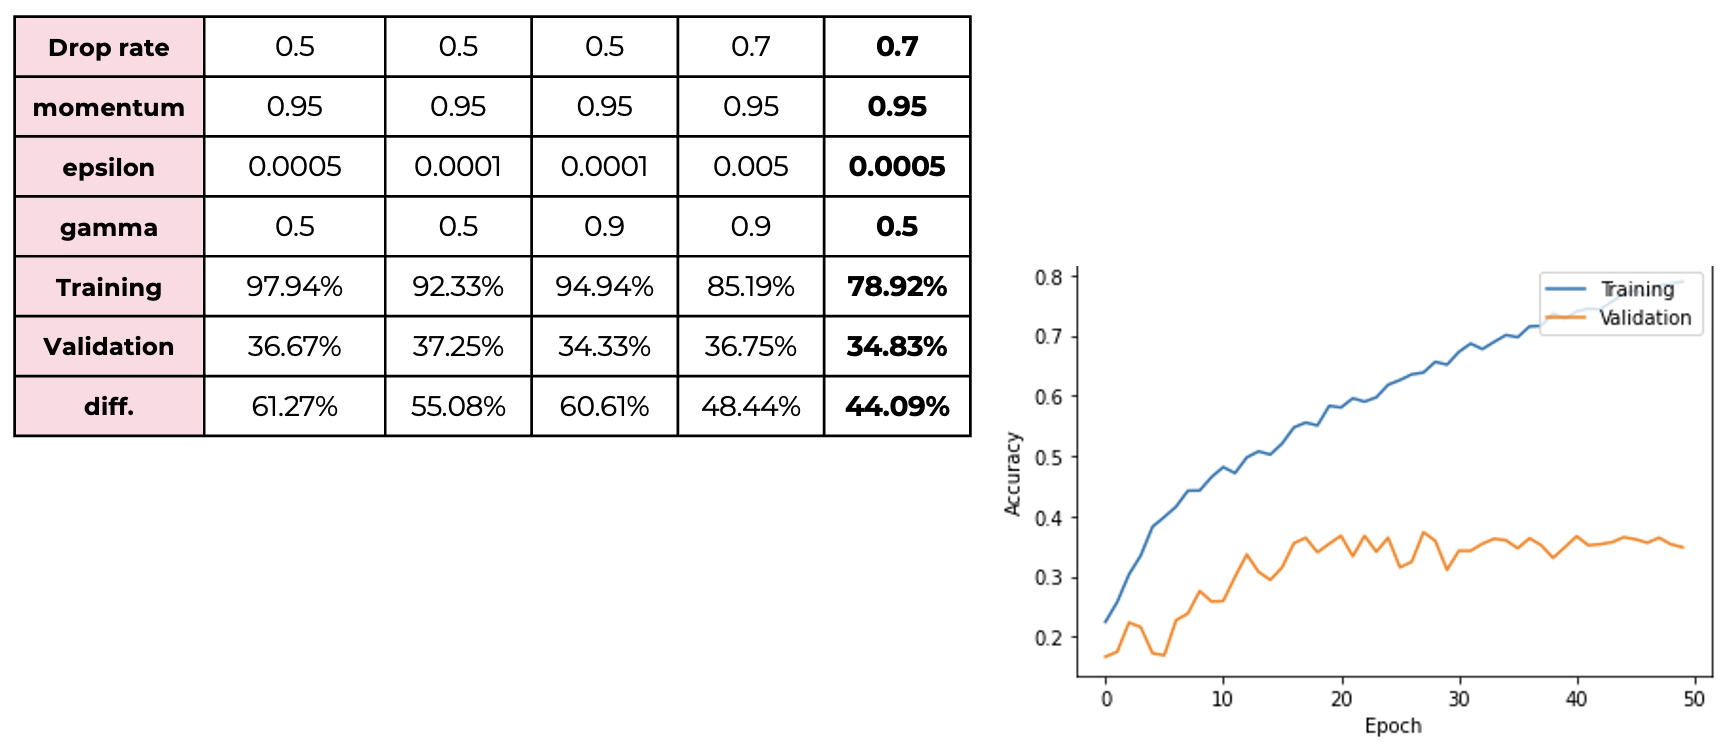 By using the mixture of dropout regularization and batch normalization, It was possible to reduce the difference compared to using batch normalization alone, but not so much.
 -
Mixture of L2, Droptout and Batch Normalization
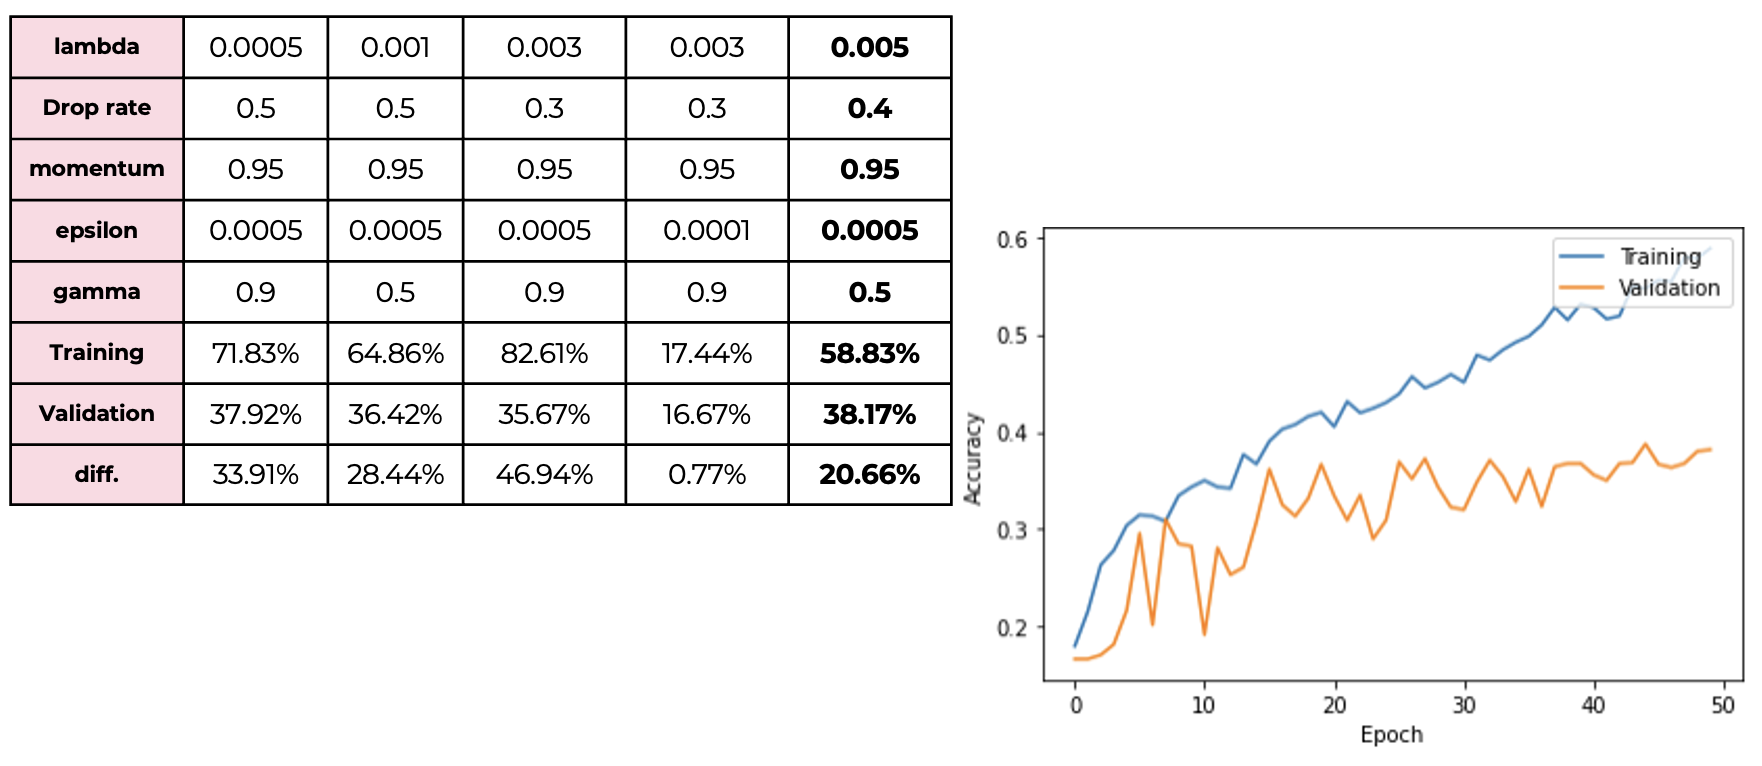 Finally, when we use all three methods together, we can get the best result. The validation accuracy is 38% and the difference between training and validation is about 20%.
 -
Early Stoppoing
Early Stopping cannot improve validation performance.
Final Model Result
Our final model’s prediction accuracy for training, validation and test set is 58.83%, 38.17% and 39.83%, respectively. It means that our moedel is able to detect human emotions with 40% accuracy by looking at facial expressions.
Business Implication
-
Market Research: Check customer facial reactions to understand how they reacted to a product.
-
Healthcare: Examine footage in a waiting room and the emergency room to determine how people are feeling.
-
Auto Manufacturers: Incorporate more facial features to alert driver falling asleep and prevent accidents.


